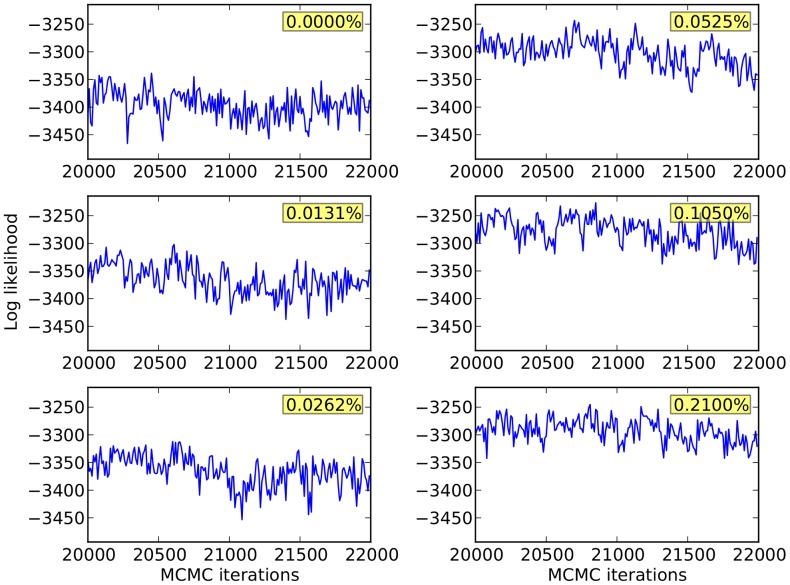
Figure 5. Log of the proportion or weight of each of the 128 components in the model.
Each panel shows a scatter plot of the log component proportions ordered by size for the HDP model fitted to each flow cytometry data sample. The largest component has a log probability of approximately -1, indicating that this single component can account for about 10% of the total events in the data sample. In contrast, the smallest component has a log probability of between -5 and -6, indicating that the smallest component only accounts for 0.001–0.0001% of the total events in the data sample. Since each sample has 50,000 events, components with log probabilities of -5 and below are likely to be empty of events. Hence, the dip at the right of each plot is an indication of cutting back by the Dirichlet process model, and provides evidence that the number of components is adequate for a good model fit. If there is no dip in the size of smallest component proportions, there is a need to increase the maximal number of components if rare event clusters are to be adequately modeled. Text in yellow boxes indicates the frequencies of the spiked antigen-specific T cells in the sample being fitted.

