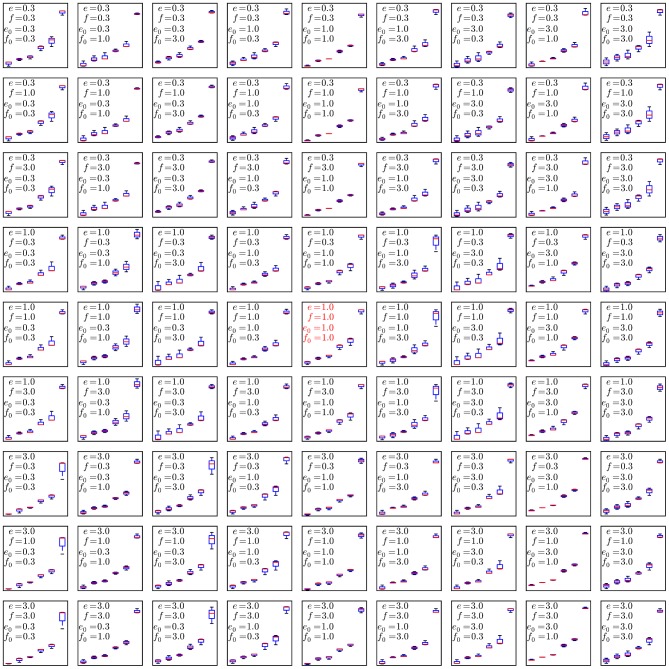
Figure 8. Sensitivity analysis for the 4 configurable hyper-parameters.
 ,
,
 ,
,
 and
and
 . To evaluate the robustness of the algorithm to changes in the configurable hyper-parameters, we repeated the analysis of the spiked in data sample multiple times with different parameters, using 10 independent MCMC runs to obtain statistics for each set of hyper-parameter configurations. Each mini-panel has the same axes as Figure 7 with estimated frequency of multimer-positive events on the vertical axis and spiked-in frequency on the horizontal axis. A boxplot is used to display the results for each model configuration. Configurable parameters were set to be either the default value (1.0), 3-fold lower (0.3) or 3-fold higher (3.0), giving 81 hyper-parameter configurations. Three replicate runs with 10,000 burn-in and 1,000 MCMC iterations were performed for each configuration. The default configuration is in the center panel with red text.

