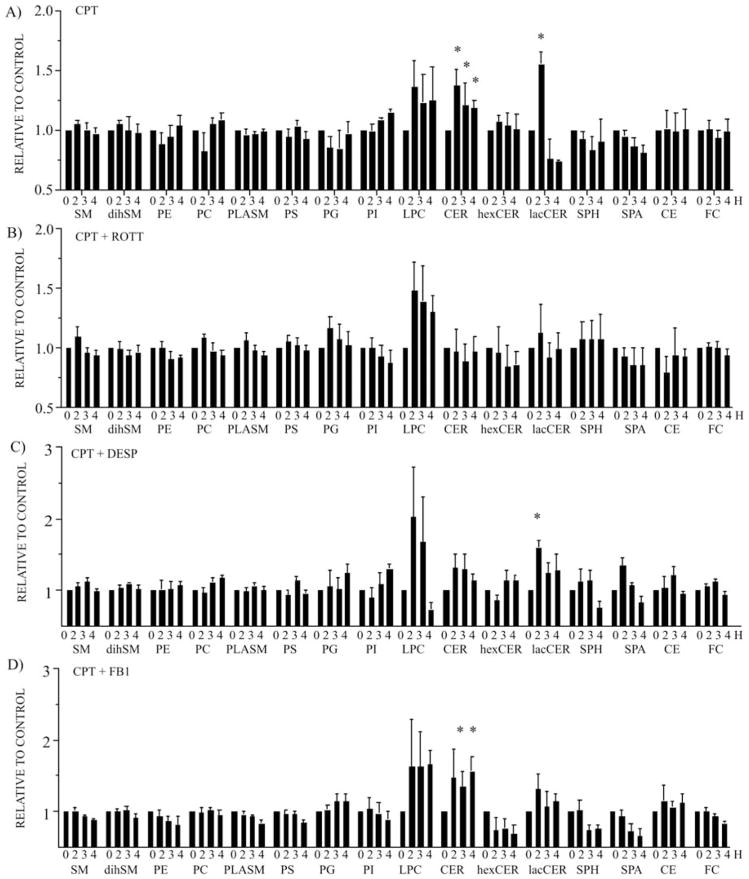
Figure 4.
PKC-δ-mediated activation of ASM leads to CER generation and accumulation in lysosomes. ESI-MS/MS lipid profiling of highly-enriched lysosomal extracts obtained from U-937 cells treated with (A) CPT (1 μM), (B) CPT (1 μM) in the presence of the PKC-δ inhibitor, ROTT (3.5 μM), (C) CPT (1 μM) in the presence of the ASM inhibitor, DESP (10 μM), and (D) CPT (1 μM) in the presence of the CS inhibitor, FB1 (10 μM). Bars represent the means of 4 independent determinations and error bars represent SEM. The data are presented as relative to the untreated control cells. *Significant differences between treated cells in comparision to the control cells.

