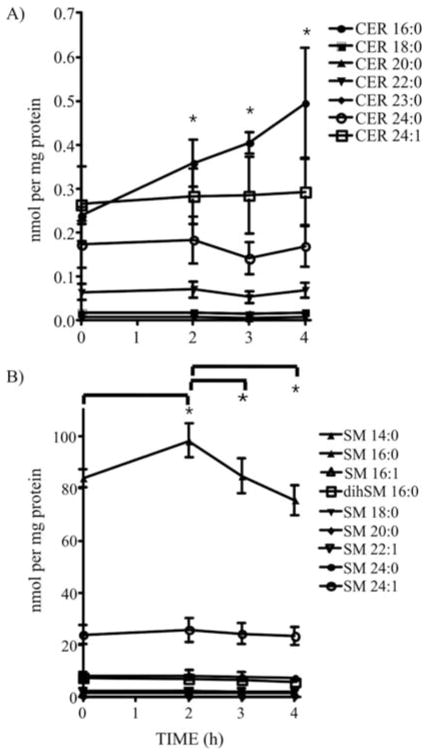
Figure 5.
Quantitative distribution of CER and SM species generated in lysosomes after CPT treatment. (A) CER and (B) SM species were analyzed by ESI-MS/MS. Data points represent the means of 4 independent determinations and error bars represent SEM. *Significant differences between treated cells versus the control cells or between data points as indicated.

