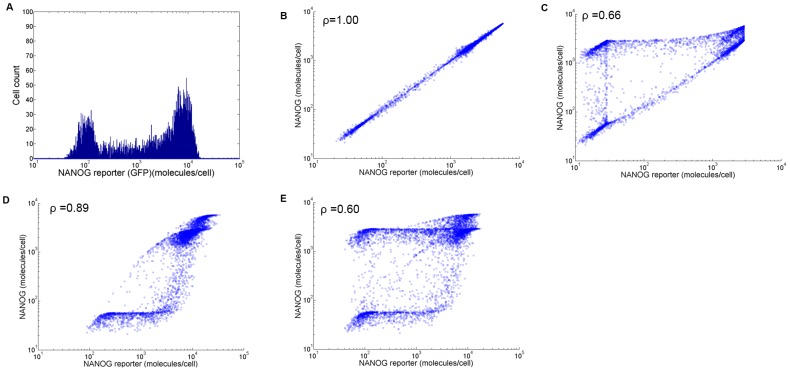
Figure 4. Reporter and endogenous NANOG protein levels under different conditions.
(A) Observed NANOG reporter (GFP) expression level in stem cells with a single-allele insertion of the gfp. The expression levels of NANOG and the reporter are shown assuming the same t1/2 (2 hours) for the reporter and NANOG and the reporter gene inserted in (B) both alleles, or (C) one allele. NANOG and reporter levels are also shown for t1/2(NANOG) = 2 and t1/2(GFP) = 20 hours with the reporter gene inserted in (D) both, or (E) a single allele. The values of the Pearson correlation coefficient (ρ) for each case (B)–(E) are shown.

