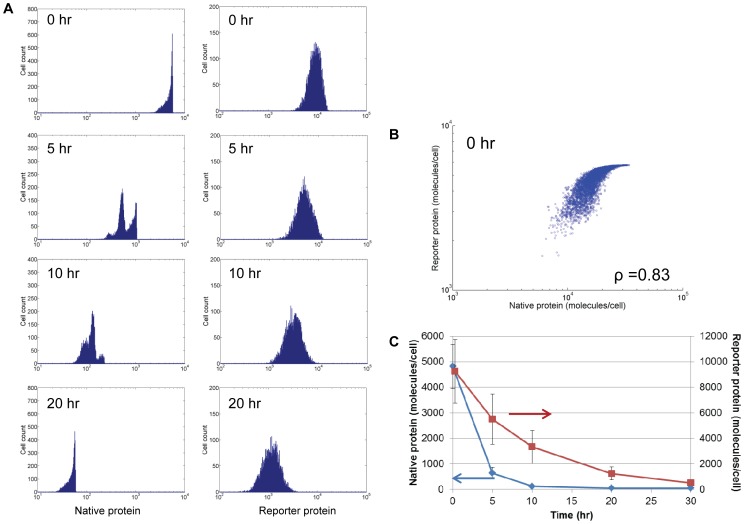
Figure 5. Correlation between endogenous protein and reporter levels in a single-allele reporter system in the absence of allelic control.
(A) At t = 0, the expression of native and reporter genes from both alleles is shut down for cells at equilibrium state. Distributions at subsequent times are shown for the endogenous and reporter proteins. (B) Endogenous protein-reporter protein scatter plot corresponding to t = 0 of (A). The Pearson correlation coefficient is also shown. (C) Average protein levels are plotted over time. Values are shown as mean±st.dev.

