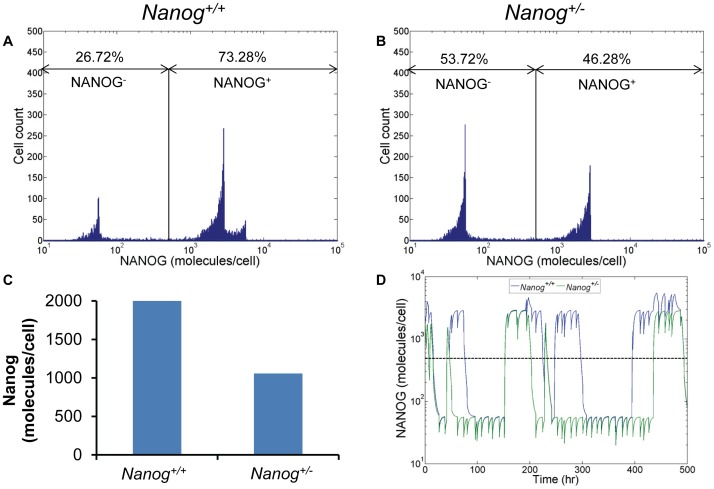
Figure 6. Prediction of the effect of single allele deletion on Nanog expression.
Nanog expression distribution in (A) Nanog +/+ and (B) Nanog +/− mESCs. The fractions of NANOG-positive and -negative cells are also shown. (C) Average NANOG expression level of Nanog +/+ and Nanog +/− cell populations calculated from the distributions in (A) and (B). (D) Comparison of Nanog fluctuations in single Nanog +/+ (blue) and Nanog +/− (green) mESCs. Dashed line indicates the threshold between NANOG+ and NANOG− cells.

