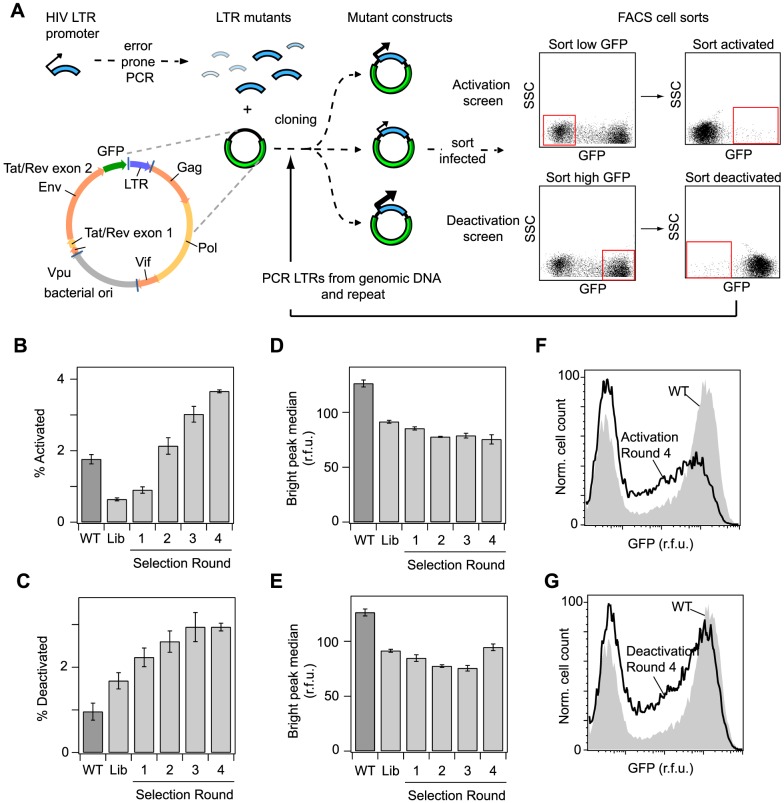
Figure 3. A dynamic forward genetic screen selects for LTR promoter sites that increase the frequency of delayed gene expression activation and deactivation.
(A) Schematic of the genetic screen. (B–G) Jurkat cells were infected with the HIV lentiviral vector containing the WT promoter, the unselected library of promoters, or promoter libraries from each round of selection for delayed activation or deactivation. (B) Fraction of cells that showed delayed activation 5 days after sorting from the Dim gate. (C) Fraction of cells that showed delayed deactivation 5 days after sorting from the Bright gate. (D,E) Median GFP expression of the bright peak for promoter libraries selected from the (D) activation screen or (E) deactivation screen. All bar graphs are presented as the mean ± standard deviation of 3 replicates, and are representative of duplicate experiments. (F,G) Flow cytometry histograms comparing the WT initial bulk, multi-integration expression profile to the profile following four rounds of selection for (F) delayed activation or (G) delayed deactivation.

