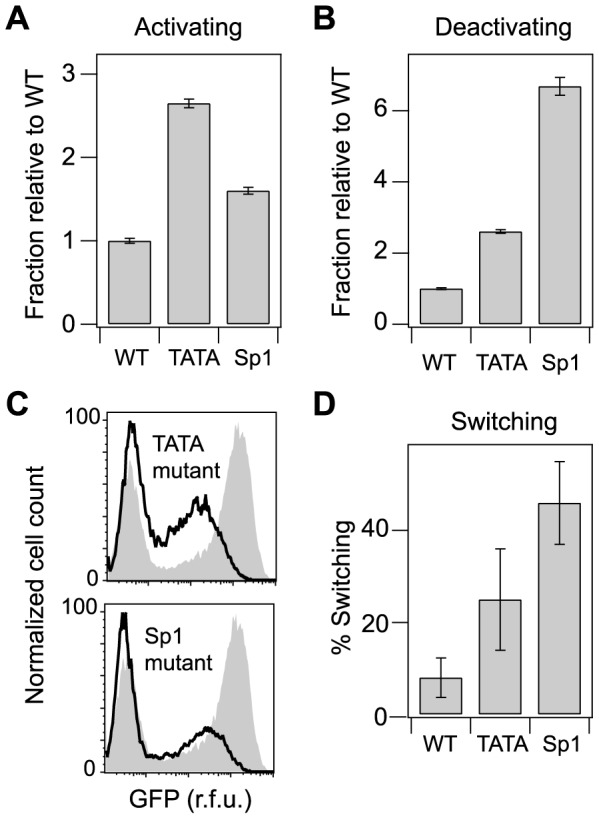
Figure 5. Selected mutations in Sp1 site III and the TATA box increase the Switching fraction.

Jurkat cells were infected with the HIV lentiviral vector containing the WT promoter, with a single point mutation in Sp1 site III (position 4), or with a single point mutation in the TATA box (position 2). (A) Relative fraction of cells that activated 5 days after sorting from the Off gate. (B) Relative fraction of cells that deactivated 5 days after sorting from the Bright gate. (C) Flow cytometry histograms comparing the WT bulk-infection profile (gray) to the profile for TATAmutP2 (left) and Sp1mutIII (right). Note the reduced weight and position of the Bright (Tat-transactivated) peak and the increased weight of the mid region. (D) Switching fractions for WT and selected mutants. Approximately 80 clones were sorted from the mid region for each infected population, and the Switching fraction was estimated as described in the main text. Error bars indicate 95% CIs, estimated by a bootstrap method. Significant differences from WT (p<0.01) indicated by (*).
