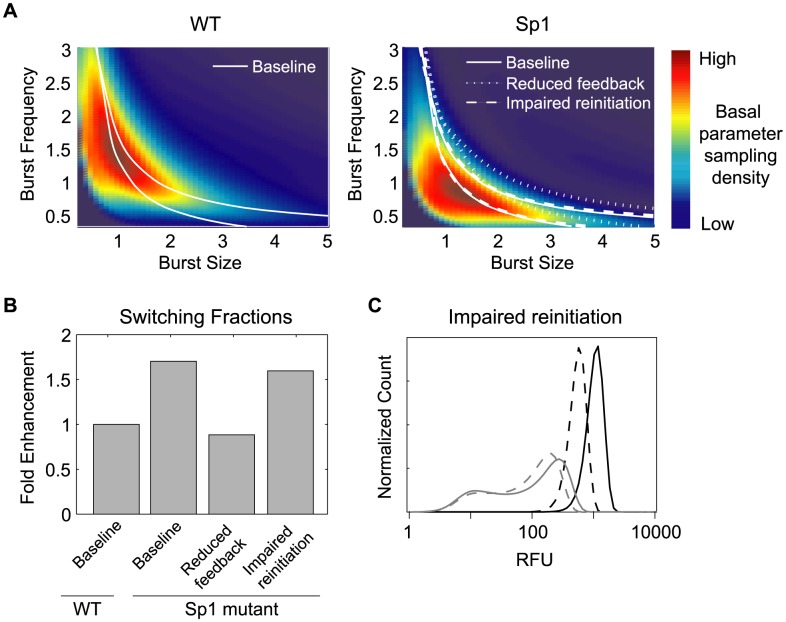
Figure 7. Computational models exploring Switching fraction modulation by the Sp1 mutation.
(A) Model phase diagrams varying basal transcriptional parameters at fixed values of Tat feedback parameters. Drawn boundaries separate parameter combinations leading to distinct phenotypes (as in Figure 2C). Superimposed color map estimates the probability density with which the virus samples basal transcription parameters over genomic integrations for the WT promoter (left) and Sp1 mutant promoter (right). Tat feedback parameters that result in a WT Switching-fraction estimate of 12% specify the solid phenotypic boundaries (base). Decreasing the fold-amplification of Tat feedback (reduced feedback, short dashed lines) shifts phenotypic boundaries to the right, while impaired reinitiation (long dashed lines) has little effect on phenotypic boundaries. (B) Estimated Switching fractions for the sets of Tat feedback parameters used in (A), normalized by the predicted WT Switching fraction for the base set of parameters (solid line). (C) Sample Switching (grey) and Bright (black) distributions for the base set of Tat feedback parameters (solid) and for impaired reinitiation parameters (dashed). The degree of transcriptional reinitiation impairment was chosen to produce a comparable shift in Bright phenotype as the parameters for reduced feedback (A–B). The model extension to include transcriptional reinitiation was implemented by a simple rescaling of model parameters according to:  (rescaled basal transcription rate);
  (rescaled amplification factor for transactivated transcription rate);
  (rescaled feedback saturation parameter). Details may be found in Text S1.

