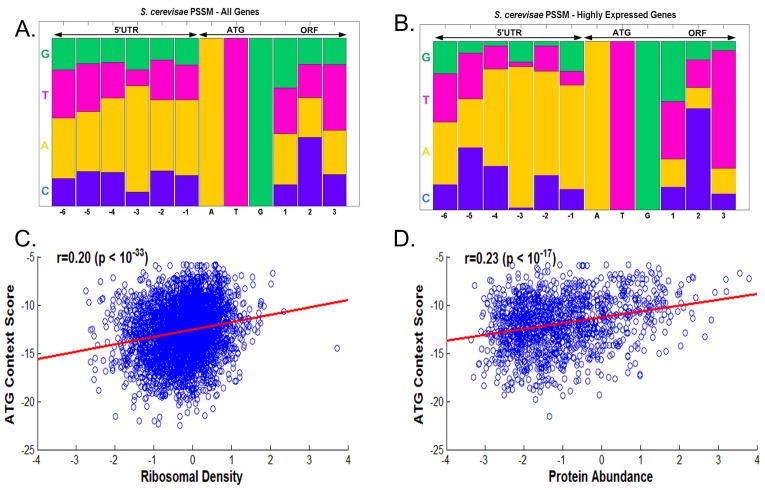
Figure 1. A–B. The position specific scoring matrix (PSSM) describing the distribution (i.e. relative frequency) of nucleotides near the main START ATG in S. cerevisiae for all genes (A.), and for genes with high ribosomal-load (B.).
C.–D. The correlation between the ATG context score and protein levels and ribosomal densities in S. cerevisiae.

