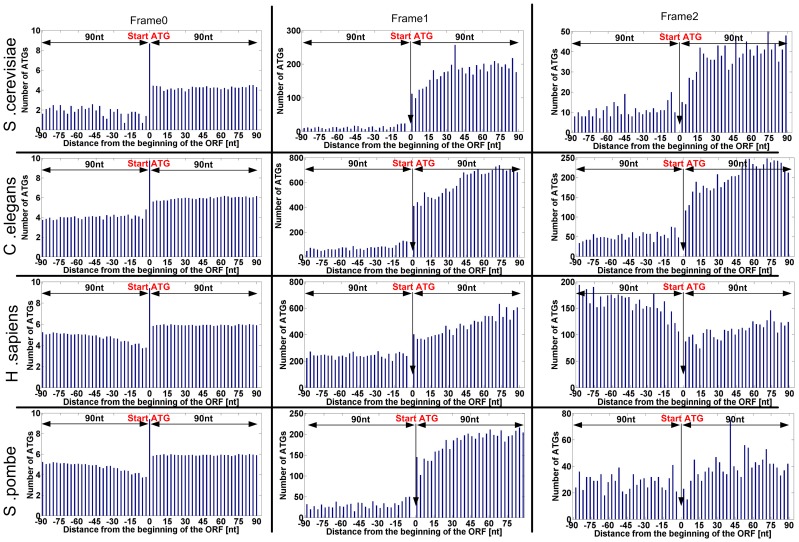
Figure 3. Genomic profiles of number of ATGs in the three frames for four model organisms (S. cerevisiae, C. elegans, S. pombe, Human).
Each x-coordinate includes the total number of ATG codons (when considering all the analyzed genes) in this position; negative values of the x-axis correspond to the 5′UTR while positive values correspond to the ORF (the coordinate of the beginning of the ORF is 0). Each organism is described by three graphs, a graph for each frame; each such graph includes only the positions corresponding to the figure frame. In the case of frame 0, since there are many ATGs at the first position (main START ATG) of the ORFs, the Y-axis is log scaled (natural logarithm; specifically in position 0, the beginning of the ORF, the number is: log(#genes with 5′UTR).).

