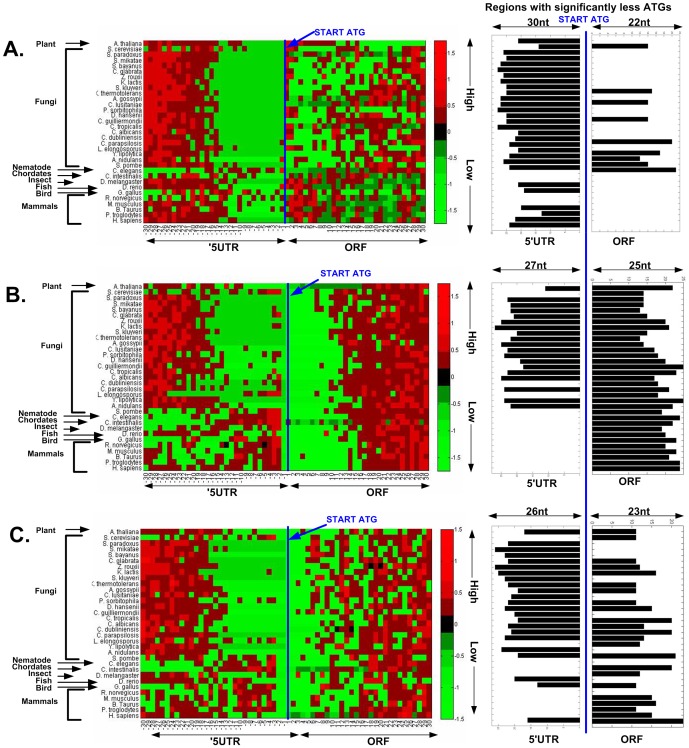
Figure 4. A–C. Genomic profiles of number of ATGs in the three frames of 33 eukaryotes' first thirty codons upstream, and downstream the START ATG (A. Frame 0, B. Frame 1, C. Frame 2).
Left part: For each organism, in each nucleotide position, the number of ATGs was scaled according the distance (in terms of the number of STDs) from the mean number of ATGs across all the positions, for the 5′UTR and ORF separately. A position with relatively more ATG codons (positive number of STDs from the mean) was marked in red (more ATGs corresponds to a more reddish color), while positions with relatively less ATG codons (negative number of STDs from the mean) were marked in green (less ATGs corresponds to a more greenish color). Right part: the length of the region with significantly lower number of ATG codons near the START ATG in the 5′UTR and ORF for each organism (Methods). As can be seen, in all frames, there is a significant universal signal of fewer ATGs near the beginning of the ORF.

