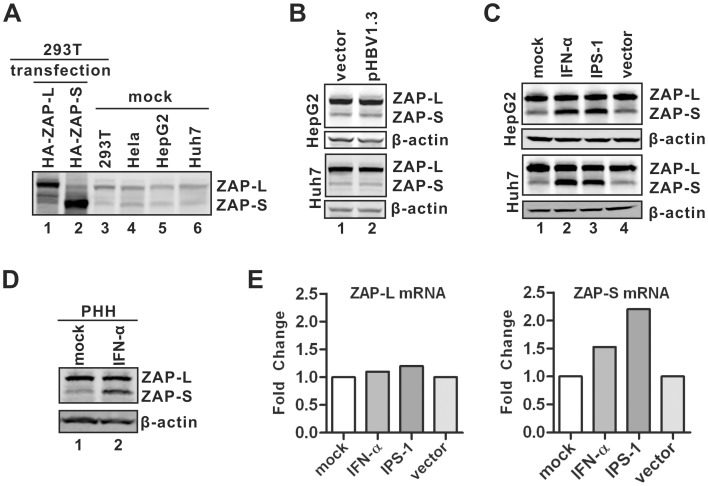
Figure 9. Expression of endogenous ZAP in hepatocytes.
(A) The basal expression of ZAP in indicated cell lines was detected by Western blot using polyclonal antibodies against endogenous ZAP. Overexpressed HA-tagged hZAP-L and -S were used as controls to validate antibody specificity. (B) HBV replication does not affect ZAP expression. HepG2 and Huh7 cells were transfected with control vector or pHBV1.3, respectively. Expression of ZAP was analyzed by Western blot at day 4 post transfection. (C–D) ZAP expression upon IFN-α treatment or IPS-1 expression. HepG2 and Huh7 cells were left untreated or treated with IFN-α (1,000 IU/ml) for 48 h. Another set of cells was transfected with plasmid expressing IPS-1 or control vector for 48 h. Primary human hepatocytes (PHH) were treated with IFN-α (1,000 IU/ml) for 48 h. Cells were then lysed and the levels of ZAP were revealed by Western blot, with β-actin serving as loading control. (E) Quantitative RT-PCR analysis of ZAP-L (left) and ZAP-S (right) mRNA in HepG2 cells stimulated for 48 h with IFN-α (1,000 U/ml) or IPS-1 expression. The results were presented as fold change of mRNA levels compared to control samples.

