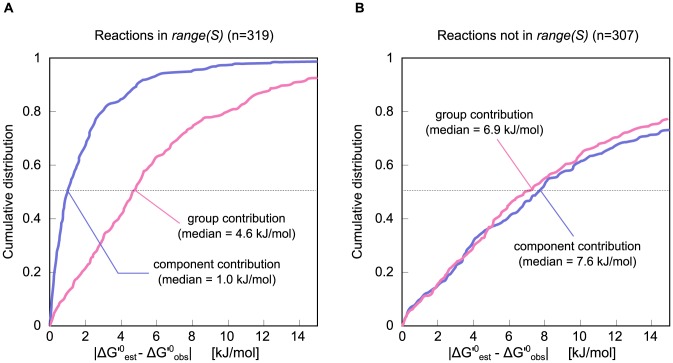
Figure 4. Cumulative distributions for the cross-validation results.
The CDF of the absolute-value residuals for both group contribution ( , pink) and component contribution (
 , purple). The reactions were separated to ones which are (A) linearly-dependent on the set of all other reactions (
 is in the range of
  , the stoichiometric matrix of all reactions except
  ), and (B) to ones which are linearly-independent (and thus component contribution uses group decompositions for at least part of the reaction). We found an 80% reduction in the median for the former set and no significant change for the latter (p-value =
  ).
).

