
Figure 5. Distribution of the fractions of reaction vectors (black).
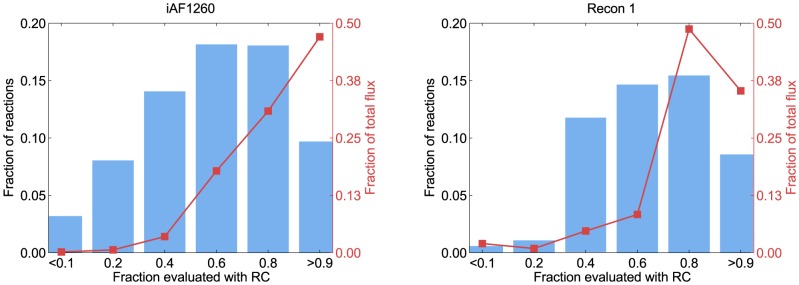
in iAF1260 (E. coli) and Recon 1 (human), that were in the range of  , and were thus evaluated with reactant contribution (RC). For a reaction
  , this fraction was calculated as
  . Passive and facilitated diffusion reactions, where the reactants undergo no chemical changes, are not included in the figure. 9.4% of all evaluated reactions in iAF1260 were fully evaluated using only reactant contributions. These reactions carried approximately half of the total flux (red) in 312 predicted flux distributions. The 8.3% of evaluated reactions in Recon 1 that were fully evaluated with reactant contributions, carried close to a third of the total flux in 97 predicted flux distributions.