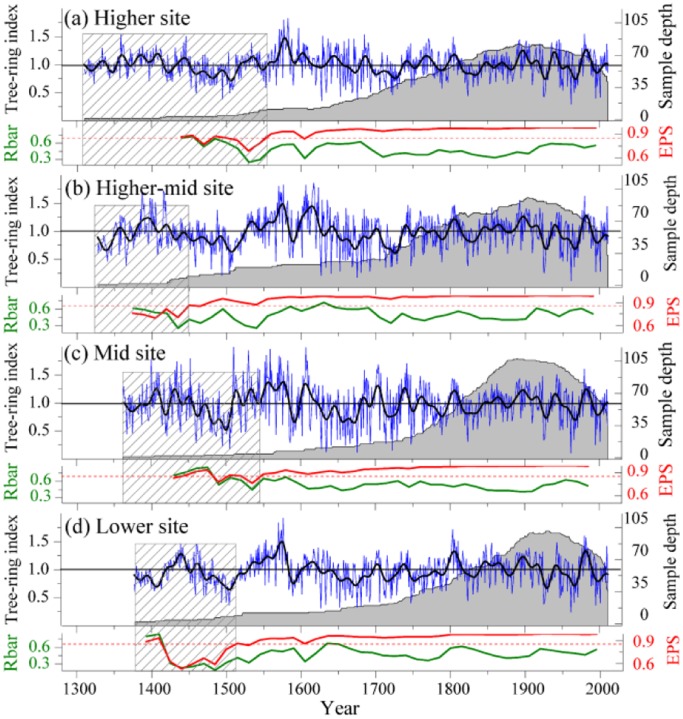
Figure 1. Comparisons of the four altitudinal standard chronologies.
a) The higher site chronology; b) the higher-mid site chronology; c) the mid site chronology; d) the lower site chronology. The blue lines are the original series and the black lines are the corresponding 11-year Fast Fourier Transformed (FFT) series with the corresponding sample depth (gray area), expressed population signal (EPS, red lines) and Rbar (olive lines) based on a 30-year window with 15-year overlaps. The dashed red line shows the EPS = 0.85 cut-off. The rectangles with gray oblique lines indicate the less reliable periods for the individual standard chronologies.

