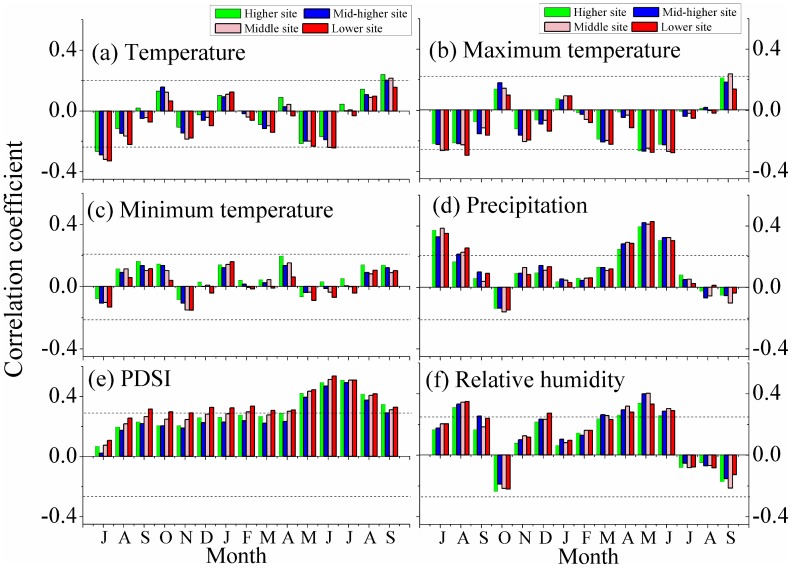
Figure 2. Correlations between climate data and the four residual chronologies over their common periods.
a) correlations with monthly temperature; b) correlations with monthly minimum temperature; c) correlations with monthly maximum temperature; d) correlations with monthly precipitation; e) correlations with monthly PDSI; f) correlations with monthly relative humidity. The horizontal dashed lines indicate the p = 0.05 significant level.

