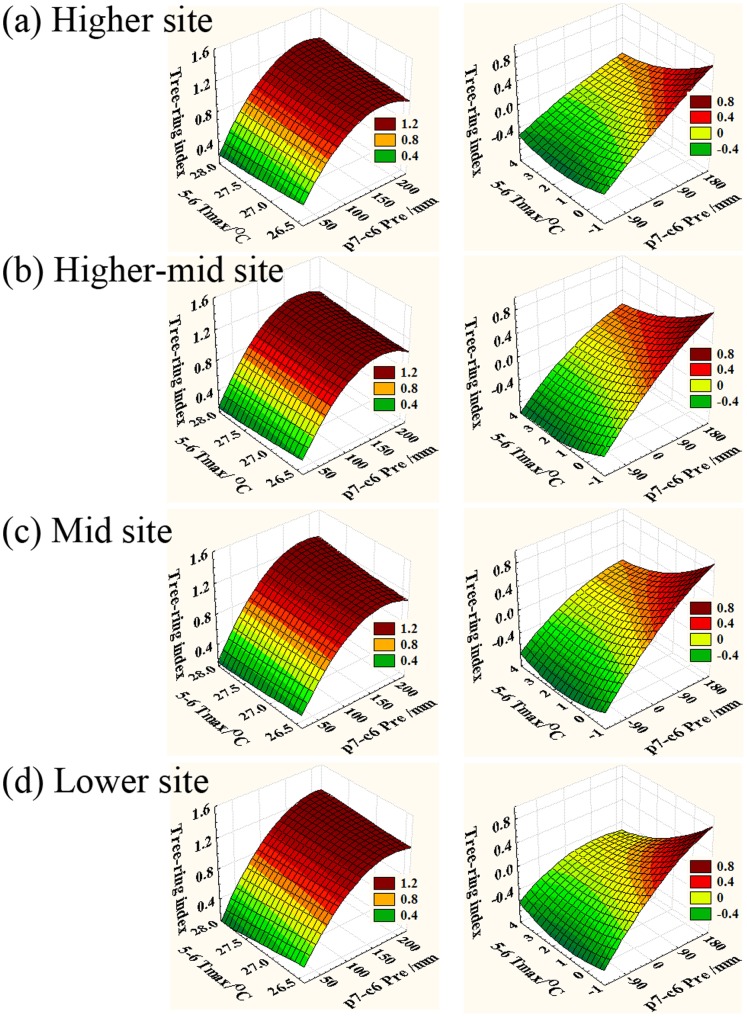
Figure 4. Results of the response surface regression analysis.
The left panel is for the RES chronologies and the right panel is for the corresponding first-order difference series of the four elevation sites. a) The higher site chronology; b) the higher-mid site chronology; c) the mid site chronology; d) the lower site chronology. The X, Y and Z axes denote annual (previous July to current June) precipitation series, current May–June maximum temperature and residual tree-ring series, respectively.

