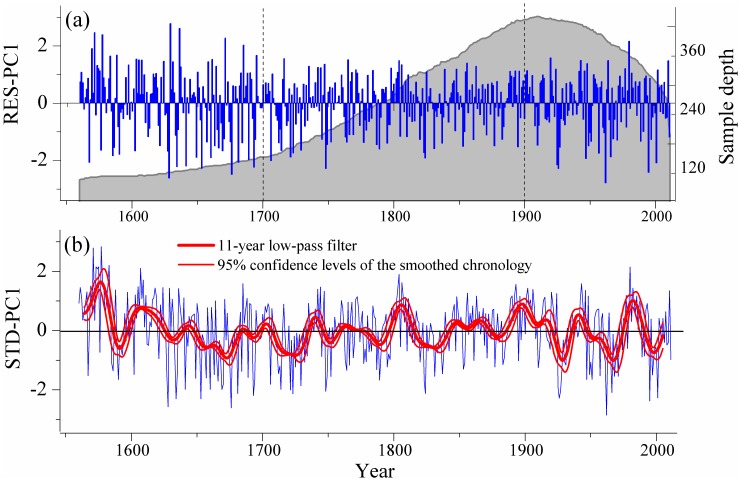
Figure 5. The PC#1 series and sample depth over the common reliable period 1560–2011.
a) PC#1 series extracted from the four residual chronologies; b) PC#1 series (blue curve) extracted from the four standard chronologies and the corresponding 11-year low-pass filtered series (red heavy curve) with the 95% confidence levels (red thin curve).

