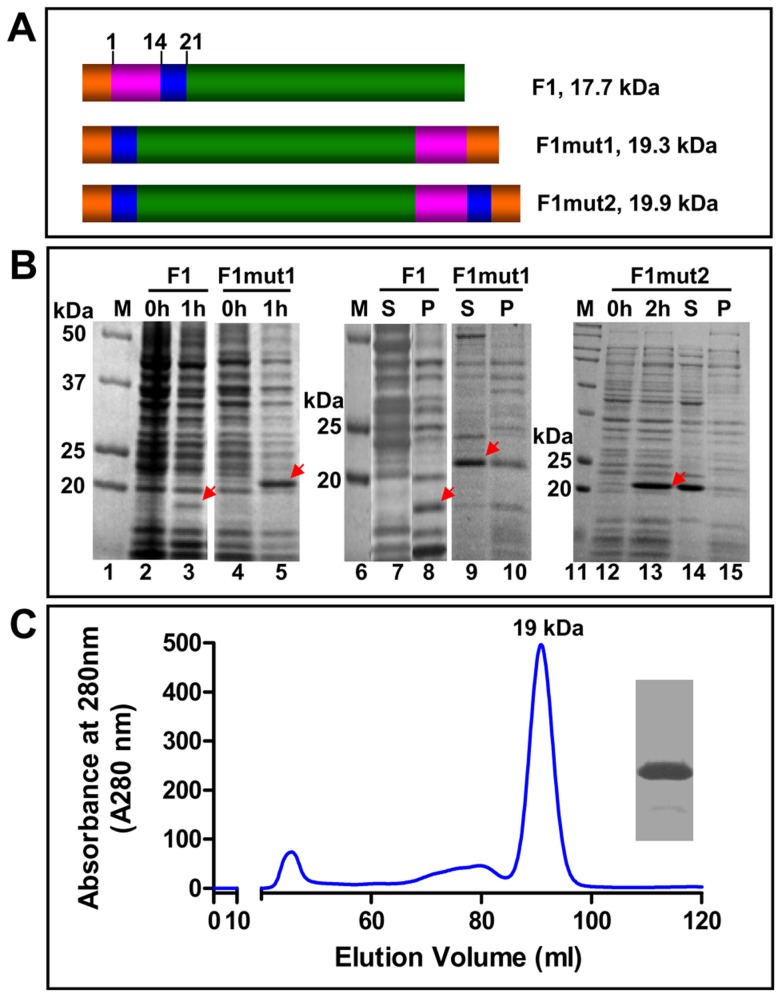
Figure 2. Designing monomeric F1 mutants.
(A) Schematic of native F1, F1mut1, and F1mut2 recombinant constructs. The donor β-strand of F1 is shown in pink, the T cell epitope region in blue, and the rest of the F1 coding sequence in green. The numbers correspond to the aa residues of F1. Native F1 has one hexa-histidine tag (orange) at the NH2-terminus, whereas F1mut1 and F1mut2 have two hexa-histidine tags, one at the NH2-terminus and another at the COOH-terminus. (B) Expression and solubility analysis. The recombinant F1 proteins were over-expressed by adding IPTG to 1 mM final concentration. The samples at 0, 1, or 2 h time points were analyzed by SDS-PAGE (15% gel) and Coomassie blue staining. The positions of F1 protein bands are marked with red arrows. The samples at 1 h or 2 h time points were analyzed for solubility using the B-PER reagent. S, soluble fraction (supernatant from 12,000 g centrifugation of the lysate); P, insoluble fraction (pellet); M, molecular weight standards. (C) Purification of F1mut1. The F1mut1 recombinant protein was purified from the cell-free lysates by HisTrap affinity chromatography followed by Hi-load 16/60 Superdex 200 gel filtration. The molecular weight of F1mut1 peak fraction was calculated from the calibration curve constructed by gel filtration on the same column of standard proteins of known molecular weight [Thyroglobulin (669 kDa), Ferritin (440 kDa), Catalase (232 kDa), aldolase (158 kDa), Ovalbumin (43 kDa), RNase A (14 kDa), and Albumin (67 kDa)]. The insert shows the purity of F1mut1 protein after SDS-PAGE and Coomassie blue staining of the peak fraction. Similar results were obtained with the F1mut2 recombinant protein. See Materials and Methods for additional details.

