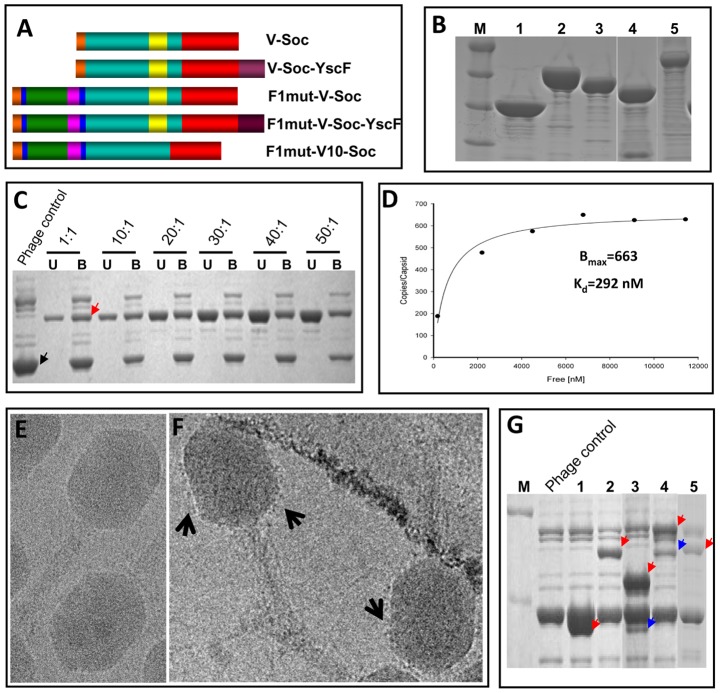
Figure 5. Engineering of F1, V, and YscF antigens and display on phage T4 nanoparticle.
(A) Schematic of Soc-fusions. Soc is shown in red and YscF in brown. Rest of the colors represents the same as shown in Figures 2 and 3. V-Soc, V was fused to the NH2-terminus of Soc; V-Soc-YscF, V was fused to the NH2-terminus and YscF to the COOH-terminus of Soc; F1mut-V-Soc, F1mut-V was fused to the NH2-terminus of Soc; F1mut-V-Soc-YscF, YscF was fused to the COOH-terminus of F1mut-V-Soc; F1mut-V10-Soc, F1mut-V10 was fused to the NH2-terminus of Soc. (B) The Soc fusion proteins in panel A were over-expressed and purified as described in Materials and Methods. The purity of the proteins was evaluated by SDS-PAGE and Coomassie blue staining. Lanes: M, molecular weight standards; 1, V-Soc; 2, F1mut-V-Soc; 3, F1mut-V10-Soc; 4, V-Soc-YscF; 5, F1mut-V-Soc-YscF. (C) Display of F1mut-V-Soc on phage T4. Approximately 3×10¹⁰ Hoc−Soc− phage particles were incubated at the indicated ratios of F1mut-V-Soc molecules to capsid binding sites and display was carried out as described in Materials and Methods. Lanes: Phage control, Hoc− Soc− phage used in the experiment (the position of gp23* band is labeled with a black arrow); U and B represent the unbound and phage-bound fractions. See the appearance of F1mut-V-Soc band in the bound lanes (red arrow), which is not present in the phage control. (D) Saturation binding curve of F1mut-V-Soc. The density volumes of bound and unbound proteins from SDS-PAGE (C) were determined by laser densitometry and normalized to that of gp23* present in the respective lane. The copy numbers were determined in reference to gp23* (930 copies per capsid). The data were plotted as one site saturation ligand binding curve and fitted by non-linear regression using the SigmaPlot10.0 software and the calculated binding parameters are shown. Kd, apparent binding constant; Bmax, maximum copy number per phage particle. (E and F) Cryo-electron micrograph of wild-type control phage T4 (E) and phage T4 decorated with F1mut-V (F). Arrows point to a layer of fuzzy projections around the perimeter of the capsid in the F1mut-V decorated phage. (G) Various Soc fusion proteins displayed on phage T4 for immunizations. Lanes: M, molecular weight standards; Phage control, Hoc− Soc− phage used in the experiment; 1, V-Soc; 2, F1mut-V-Soc; 3, V-Soc-YscF; 4, F1mut-V-Soc-YscF; 5, F1mut-V10-Soc. Red arrows show the positions of various displayed protein bands. Presence of a second fainter and shorter band in lanes 3 and 4 (blue arrows) indicate that some of the C-terminally fused YscF was cleaved off by nonspecific proteolysis.

