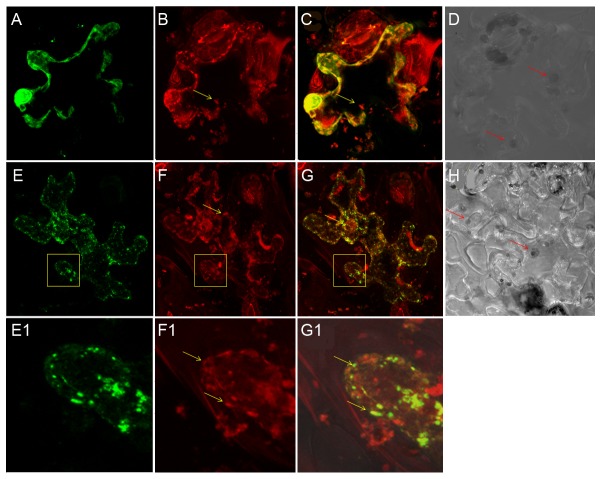
Figure 5. Mitochondrial localization of the Las autotransporter LasAI.
A-G1: confocal laser scanning micrographs. GFP expression and MitoTracker labeling were detected in tobacco leaves infiltrated with pGDY and pGDY-lasA I-TD plasmids, respectively. A, E: GFP detection with 505-530 nm BP filter; B, F: MitoTracker detection with 560 nm LP filter; C, G: merged scans; D, H: differential interference contrast (DIC) micrographs of tobacco cells with chloroplasts (red arrows). E1, F1, G1: magnifications of yellow boxes in panels E, F and G. Mitochondria (yellow arrows).

