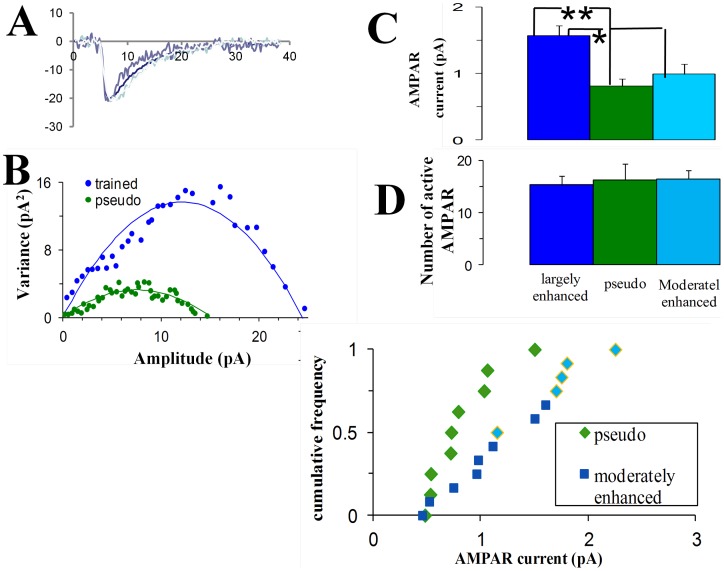
Figure 3. The average AMPAR-mediated conductance is doubled in the greatly-enhanced-trained-group.
A, B. Events were peak scaled (A) and only events with rise-time <1.5 ms were used for the NSFA analysis. Variance between these peak scaled events was calculated at different time points. Current-variance plot extracted from the peak scaled mEPSC's using the NSFA analysis could be well fitted with the parabolic current-variance equation (see Methods), allowing the extraction of the averaged single channel conductance and averaged number of active AMPA channels. Examples from a pseudo-trained cell (green) and from a cell in the greatly-enhanced-trained-group (blue) are shown (B). C. The averaged AMPA single channel conductance in the greatly-enhanced-trained-group was doubled compared with the pseudo-trained group, and is 59% bigger than in the moderately-enhanced-trained group. Values represent mean ± SE, (**, p<0.01. *, p<0.05). D. The number of active AMPA channels does not differ between groups. E. The greatly enhanced group shows distinct values of averaged AMPAR conductance as compared with the moderately enhanced group.

