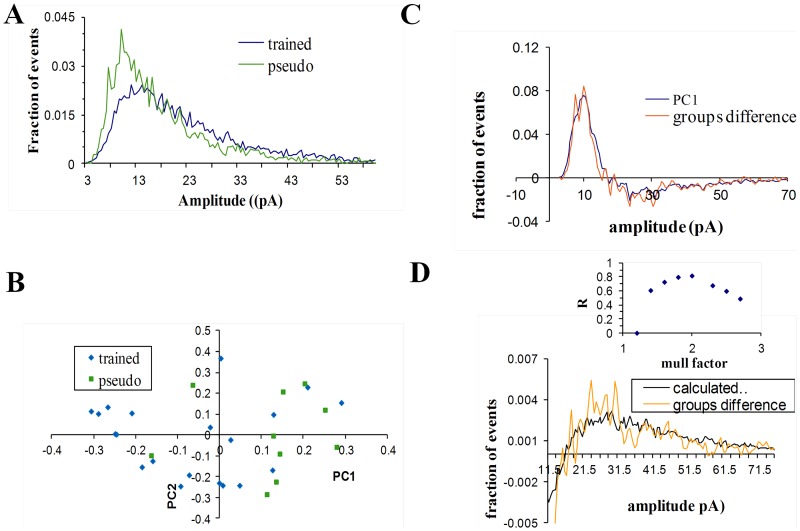
Figure 5. The learning-induced modulation of the inhibitory unitary synaptic events amplitude is dominated by a single process in which the events amplitude was doubled.
A. For each neuron an amplitude distribution curve was reconstructed from the mIPSC's amplitudes and was normalized (data taken form [17]). Averaged amplitude histograms, were calculated for all neurons from the three groups. Notably, a significant portion of events in the trained group are of higher values. B. For each cell the weight for the first component (X-axis) was drawn against its weight for the second component (Y-axis). Only the weights of the first component are significantly different between groups. C. The curve calculated by subtracting the averaged pseudo amplitude distribution curve from the averaged trained amplitude distribution curve (orange) match the first component calculated by PCA (black). D. For each multiplication factor a different curve that describes the difference between groups assuming a multiplication model was calculated. The calculated curve assuming multiplication factor of 2 (black) matched the curve that describes the main difference between groups (orange). Inset: the correlation coefficient was calculated for each multiplication factor (for calculation of R only amplitudes >13pA were used, since at lower amplitudes, multiplication factors bigger than two requires unavailable data in amplitudes <6pA, see Methods).

