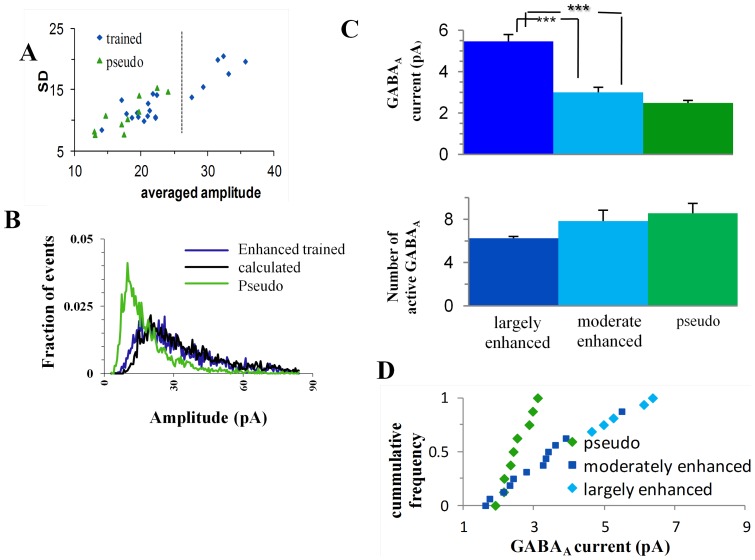
Figure 6. In a sub-group of cells from trained rats, amplitudes of all inhibitory miniature events are doubled.
A. Each cell was plotted as a function of its averaged event amplitude and standard deviation. Few cells from trained-group had exceptionally large averaged amplitudes and Standard-deviations. Using hierarchical clustering analysis the cells were divided to two groups (separated by the dotted line; the same division was obtained for all the methods that were implemented). B. The distribution curve describing the greatly-enhanced trained neurons can be constructed from the distribution curve describing the pseudo-trained neurons. The expected curve (black) calculated from pseudo events (green) overlaps the averaged distribution curve of the greatly-enhanced-trained group (blue). (r = 0.85, only amplitudes >13pA were used, since at lower amplitudes, multiplication factors bigger than two requires unavailable data in amplitudes <6pA, see Methods) C. The averaged GABAA single channel conductance in the greatly-enhanced-trained-group was doubled compared with the pseudo-trained group, and is 82% bigger than in the moderately-enhanced-trained group. Values represent mean ± SE, (***, p<0.001). The number of active GABAA channels does not differ between groups. D. The greatly enhanced group shows distinct values of averaged GABAAR conductance as compared with the moderately enhanced group.

