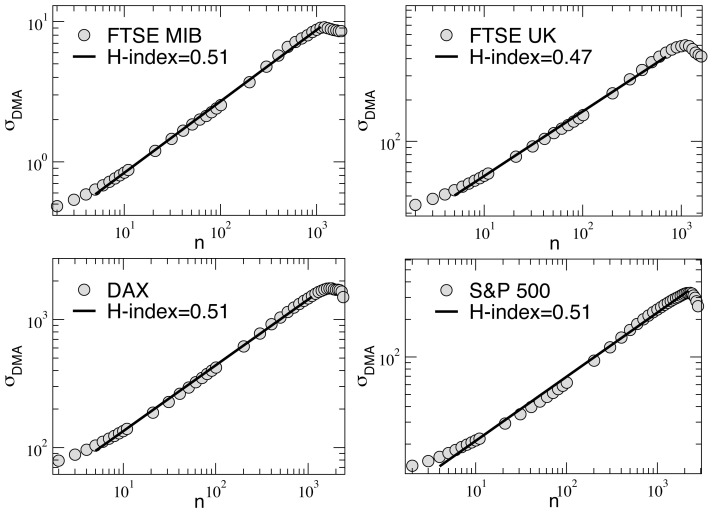
Figure 2. Detrended analysis for the four financial market series shown in Fig. 1.
The power law behavior of the DMA standard deviation allows to derive an Hurst index that, in all the four cases, oscillates around 0.5, thus indicating an absence of correlations, on average, over large time periods. See text.

