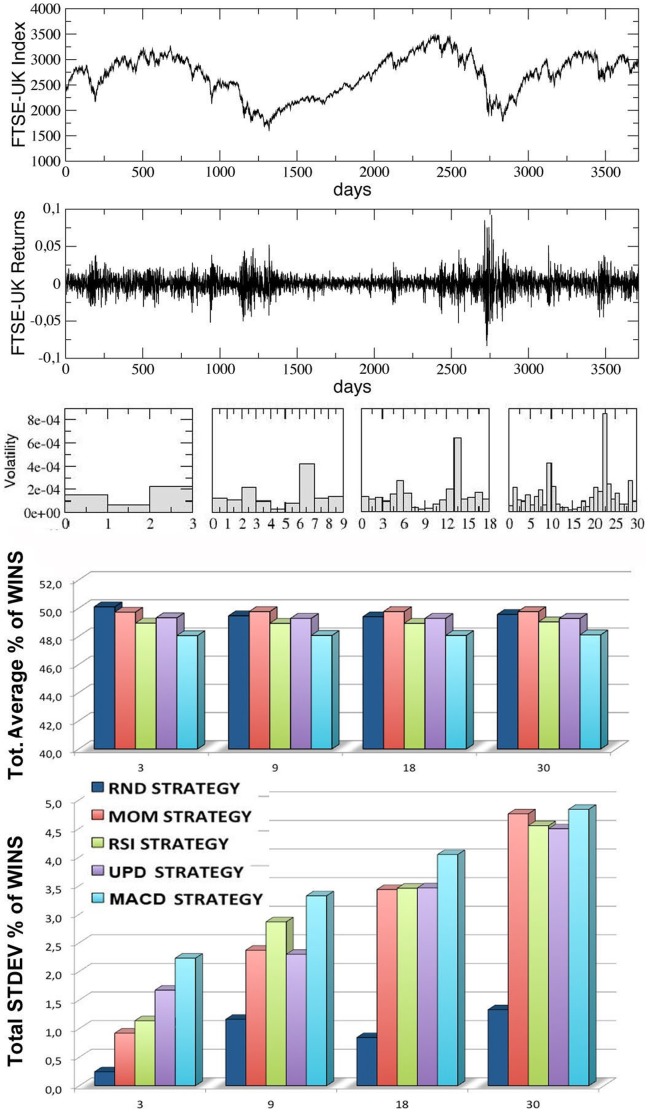
Figure 5. Results for the FTSE-UK index series, divided into an increasing number of trading-windows of equal size (3,9,18,30), simulating different time scales.
From top to bottom, we report the index time series, the corresponding returns time series, the volatility, the percentages of wins for the five strategies over all the windows and the corresponding standard deviations. The last two quantities are averaged over 10 different runs (events) inside each window.

