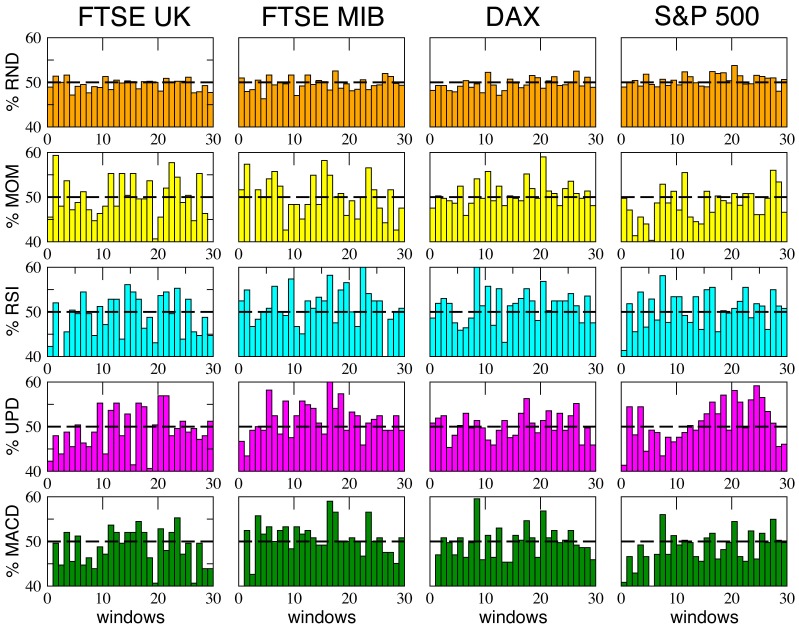
Figure 9. The percentage of wins of the different strategies inside each time window - averaged over 10 different events - is reported, in the case Nw = 30, for the four markets considered.
As visible, the performances of the strategies can be very different one from the others inside a single time window, but averaging over the whole series these differences tend to disappear and one recovers the common  outcome shown in the previous figures.

