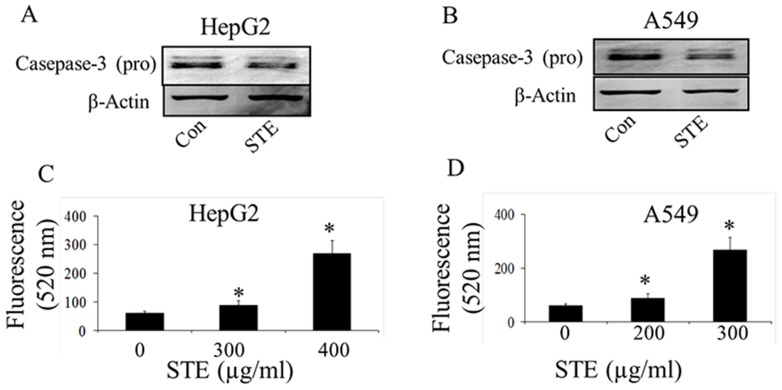
Figure 3. Activation of caspase-3 in STE- treated HepG2 and A549 cells.
Activation of caspase -3 in STE-treated HepG2 cells and A549 cells was determined by western blot and fluorescence based assay. Status of pro-caspase-3 in STE (IC50 dose)-treated cell lines was determined by western blotting (A & B). Activity of caspase-3 in STE-treated HepG2 cells (C) and A549 cells (D), were determined by measuring the green fluorescence of the carboxyfluorescein-labeled fluoromethyl ketone peptide inhibitor (FLICA), using an excitation wavelength of 490 nm and an emission wavelength of 520 nm by a Jasco F 6300 spectrofluorimeter. Data represent the mean ±SEM (*p<0.05 vs control, n = 3).

