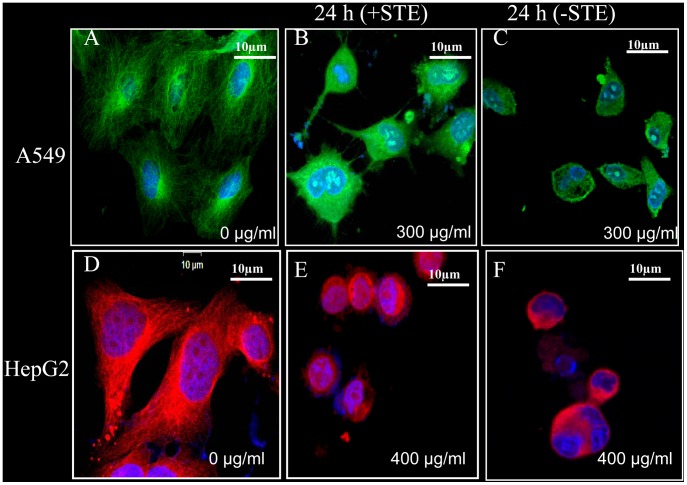
Figure 6. Irreversible disruption of the microtubule network in STE-treated A549 and HepG2 cells.
Cultured A549 and HepG2 cells were treated with respective IC50 STE doses, with appropriate control sets (untreated cells). After 24 h of incubation, the media containing STE was replaced with fresh normal media without STE as discussed in methods. (A–C) Control and treated A549 cells were incubated with FITC-conjugated mouse monoclonal anti-tubulin antibody and images were captured by a Ziess confocal microscope LSM 510 meta. (D–F) Control and treated HepG2 cells were incubated with anti-tubulin (mouse monoclonal) antibody and corresponding rhodamine conjugated (red) secondary antibody and images were captured by a Ziess confocal microscope LSM 510 meta. The results represent the best of data collected from three experiments with similar results.

