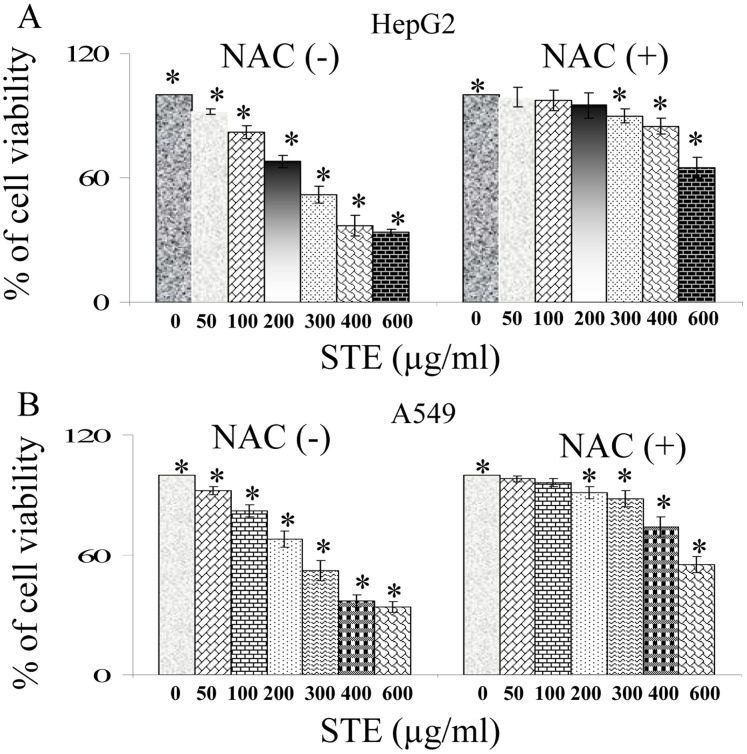
Figure 9. Attenuation of STE induced cytotoxicity in both HepG2 and A549 cells by N-acetyl cysteine (NAC).
Determination of the viability of HepG2 and A549 cells treated with STE (0–600 µg/ml) alone or incubated with 500 µM NAC prior STE-treatment. Viability for (A) HepG2 and (B) A549 cells was determined by MTT assay. Data are represented as the mean ±SEM (*P<0.05 vs control or STE untreated +NAC treated cells), where n = 4.

