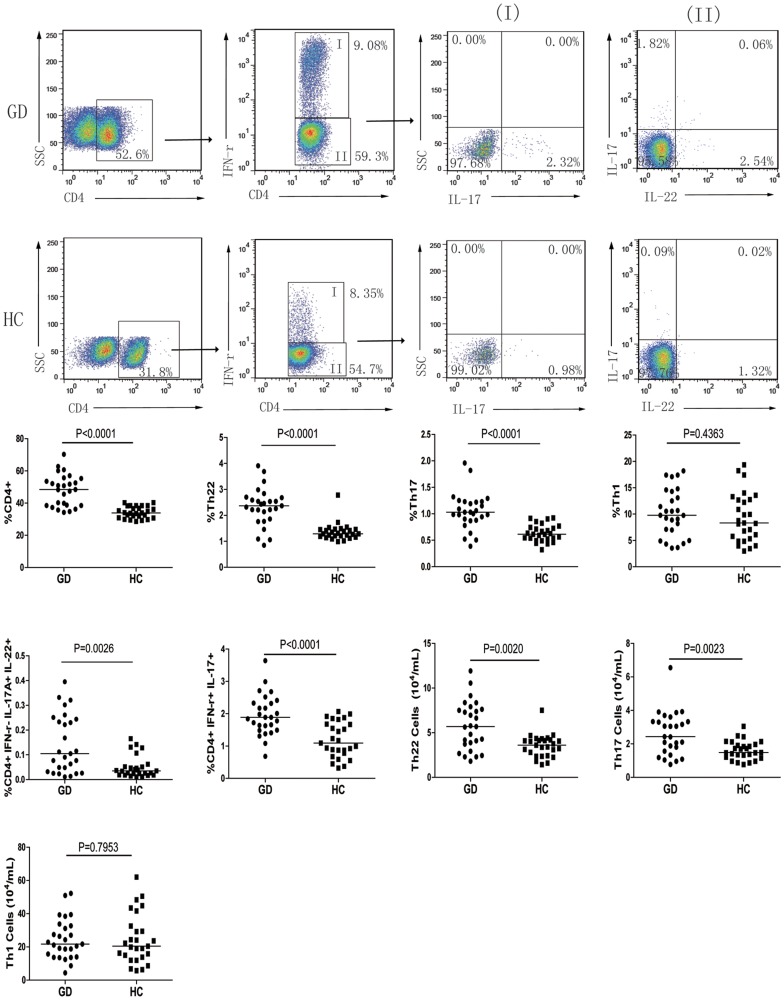
Figure 1. Flow cytometry analysis of different subsets of CD4+ T cells.
PBMCs were isolated form individual participants and stimulated with, or without, PMA/ionomycin and harvested. The cells were stained with APC-anti-CD4, fixed, and permeabilized, followed by intracellular staining with FITC-anti-IL-17, PE-Cy7-anti-IFNγ, and PE-anti-IL-22 and flow cytometry. Subsequently, the cells were gated first on CD4+ cells for analysis of the frequency of CD4+IFNγ+ and CD4+IFNγ− cells. The CD4+IFNγ+ cells were further analyzed for CD4+IFNγ+IL-17+ cells (column I), while the CD4+IFNγ− cells were further analyzed for CD4+IFNγ−IL-17+, CD4+IFNγ−IL-22+, and CD4+IFNγ−IL-17+IL-22+ cells (column II), followed by quantitative analyses. Data are representative charts or expressed as the mean values of individual participants from sequential experiments. A. Representative charts of flow cytometry analysis; B. Quantitative analysis.

