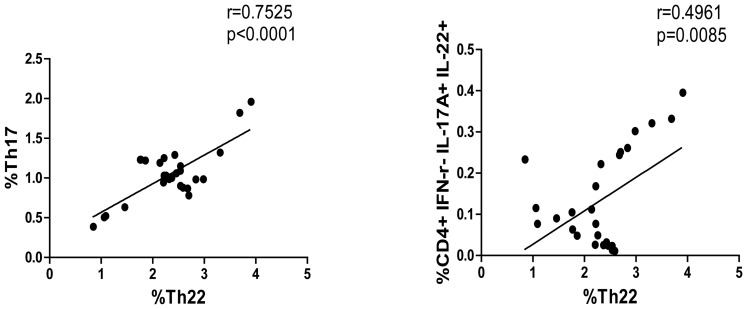
Figure 2. The correlation between the percentages of Th17, Th22 and Th17/Th22 cells in patients.
The potential correlations among different subsets of CD4+ T cells were analyzed by Spearman rank correlation test. Data shown are the mean values of individual patients (n = 27). There was no significant correlation between the percentages of Th17 and Th17/Th22 cells in those patients.

