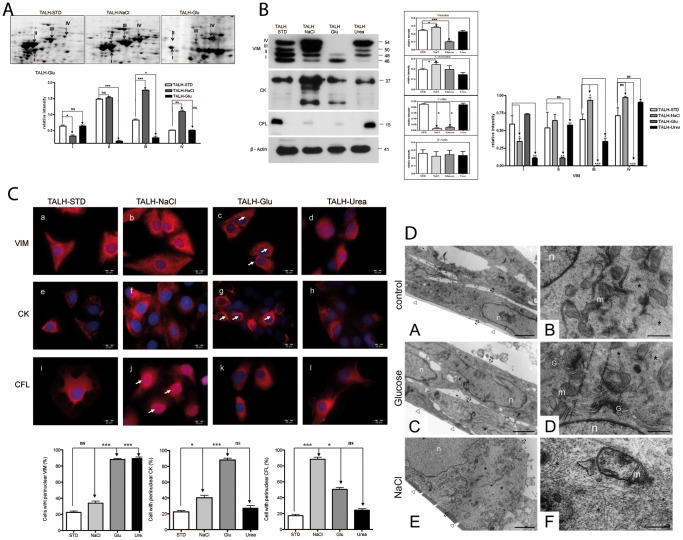
Figure 1. Differential expression regulation of cytoskeletal proteins under different osmotic stress conditions.
A: Enlargments of gel regions in the range of pH 5–8 that were cropped from Flamingo fluorescence dye stained 2D-gels. The panels show differential expression of VIM forms in control cells (TALH-STD) and cells cultured in hyperosmolarity medium of NaCl (TALH-NaCl) and glucose (TALH-Glu). Quantitative analyses were carried out by comparing the VIM expression changes between TALH-STD and –NaCl and between TALH-STD and –Glu. The expression quantification of the spots is presented as a grouped bar chart with error bars. Each bar represents the intensity means ± S.D. of vimentin protein spots from 3 independent experiments. Significant differences: (*) p<0.05, (**) p<0.01, (***) p<0.001. B: Ci Western blot analysis of cytoskeletal proteins VIM, CK, and CFL in TALH-STD, TALH-NaCl, TALH-Glu, and TALH-Urea cells. VIM showed 4 different bands, called forms I (46 kDa), II (48 kDa), III (50 kDa), and IV (54 kDa), from lower to higher molecular weight, respectively. VIM forms showed differential regulation under different stress conditions, where β-actin, used as control, was equally expressed. Cii the WB bands from the different VIM forms (I–IV) were quantified separately. CK showed four different bands in Western blot, all the four bands were up-regulated in TALH-NaCl. In TALH-Glu cells only the form with lowest molecular weight showed slightly up-regulation, when compared to TALH-STD. CFL expression level was significantly down-regulated in TALH-NaCl –Glu. The expression quantification is presented as a grouped bar chart with error bars on the left. Each bar represents the intensity means ± S.D. of blots from 3 independent experiments. Significant differences: (*) p<0.05, (**) p<0.01, (***) p<0.001. C: Immunofluorescence staining of TALH-cells using mouse anti-VIM (a, b, c, d), anti-CK (e, f, g, h), and anti- CFL (i, j, k, l) antibodies in TALH-STD, TALH-NaCl, TALH-Glucose, and TALH-Urea cells, respectively. VIM builds a strong filamentous network in TALH-NaCl (b) cells compared to strong perinuclear restriction in TALH-Glu (c) cells. The number of cells with perinuclear localisation of the stained protein (VIM, CK or CFL) was counted and presented in per cent of the total number of cells in the wells. The stressed cells were compared with the TALH-STD. Each bar represents the number of cells with perinuclear localization in % (± S.D of 200 counted cells/well from 3 independent wells. Significant differences: (*) p<0.05, (**) p<0.01, (***) p<0.001. Arrows indicate the cell with perinuclear localisation of IFs. In case of (J) the arrows indicate the perinuclear localisation of CFL. All the scale bars represent 20 µm; D: TALH-STD, -NaCl- and -Glu cells, respectively, were seeded on 96-well plates and allowed to attach for 24 h. The cells were processed as described in material and methods. Slices were contrasted with uranyl acetat and lead citrate. Analysis of the section was done with a LEO906 E electron microscope. Right and left panel represents same cells with different magnification n: nucleus, m: mitochondria G: golgi apparatus, Δ: plastic foil (where the cells attach), arrow: indicate the border of the cells *: indicate the IFs localization. All the scale bars on the left panel represent 2 µm and on the right panel represent 5 µm.

