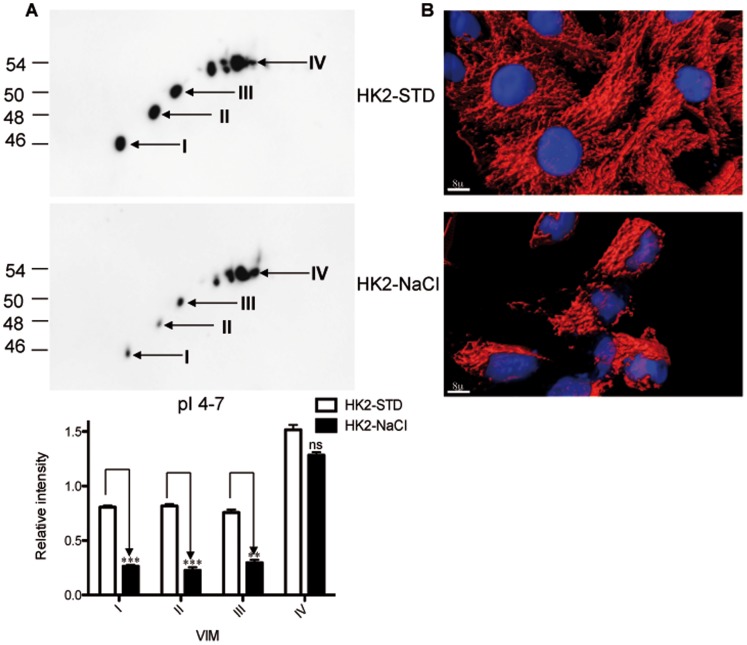
Figure 3. Differential expression of VIM forms under osmotic stress conditions in HK2renal epithelial cells.
A: 2D western blot analysis of VIM expression in HK2-STD and HK2-NaCl cells in the pI range 4–7. Lower forms of VIM showed a decrease in expression in HK2-cells adapted to high NaCl. B: Immunofluorescence staining of VIM in HK2-NaCl cells showed an extended network compared to HK2-STD cells the scale bars represent 8 µm.

