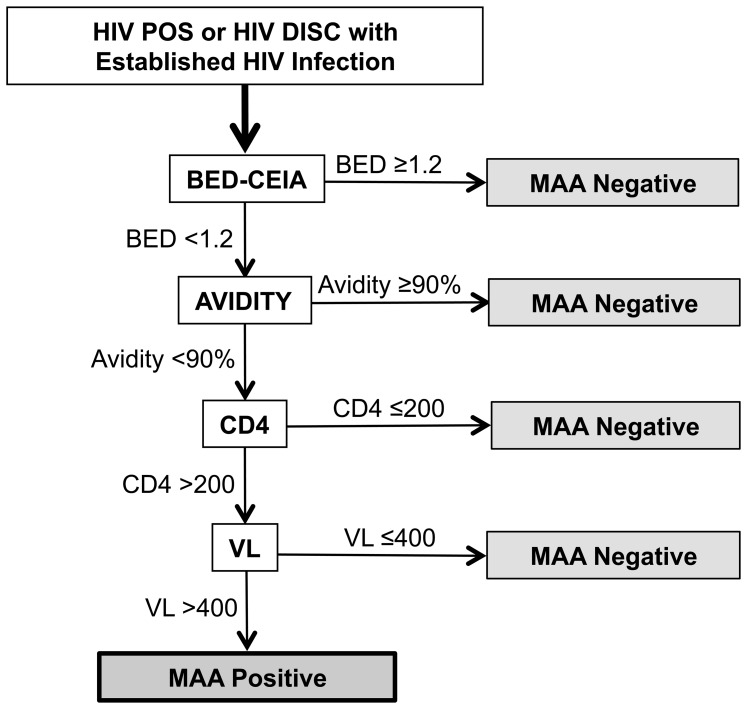
Figure 3. Multi-assay algorithm (MAA) used for HIV incidence estimation.
Study samples were initially designated as HIV NEG, HIV DISC, and HIV POS based on HIV rapid testing performed at study sites (see Methods). HIV POS and HIV DISC samples (those that had at least one reactive HIV rapid test) were further evaluated at the HPTN Network Laboratory to determine the HIV status of each sample. The majority of the HIV POS samples and some of the HIV DISC samples were determined to be from individuals with established HIV infection (Table 3). Those samples were analyzed further using a multi-assay algorithm (MAA) developed for HIV incidence estimation. The figure shows the MAA testing schema. Samples were initially tested with the BED capture immunoassay (BED-CEIA) and an avidity assay. Samples that had a BED-CEIA result ≥1.2 normalized optical density units (OD-n) were considered to be MAA negative and were not evaluated further. The remaining samples were evaluated based on results of the avidity assay. Samples that had an avidity assay result (avidity index) ≥90% were considered to be MAA negative and were not evaluated further. The remaining samples were evaluated based on results of CD4 cell count testing that was performed at study sites around the time of sample collection (CD4). Samples that had CD4 cell count result <200 cells/mm3 were considered to be MAA negative and were not evaluated further; if a CD4 cell count result was not obtained at the time of sample collection, recency could not be assessed. The remaining samples were tested using an HIV viral load assay (VL). Samples that had a viral load result <400 copies/mL were considered to be MAA negative and were not evaluated further. Samples that met all of the criteria for the MAA (BED-CEIA <1.2 OD-n+avidity index <90%+CD4 cell count >200 cells/mm3+ HIV viral load >400 copies/mL) were classified as MAA positive.

