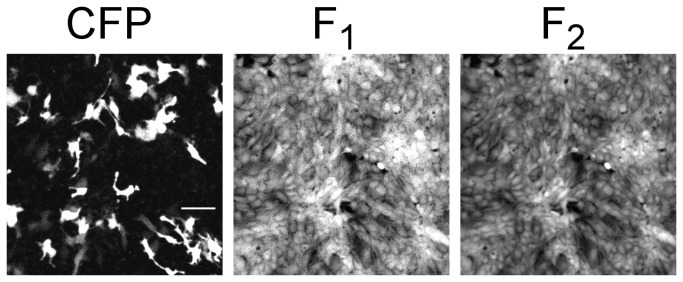
Figure 1. Sample images from dataset (raw data).
Cultured opossum kidney (OK) cells were used in procedures described herein. CFP: representative fluorescence image of cells expressing cyan fluorescent protein, used herein as a slc26a3 transfection marker; excitation wavelength 457 nm and emission wavelength 495 nm long pass. White scale bar represents 100 µm, and is applicable to other two images, which encompass the same field of view. F1 and F2: representative fluorescence images at two wavelengths used for ratiometric monitoring of intracellular pH through the pH-sensitive intracellular dye SNARF-5F; excitation wavelength 561 nm and emission wavelengths 570-590 nm and 610-670 nm.

