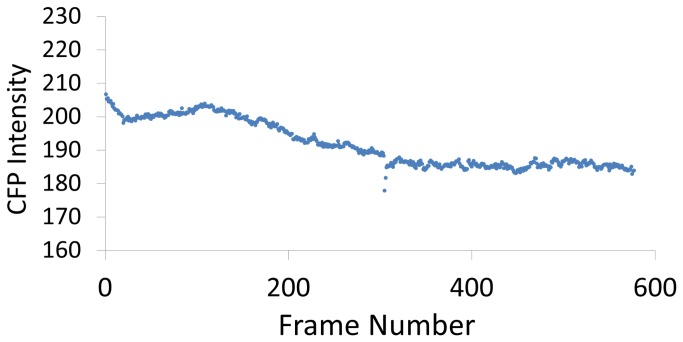
Figure 3. Decay of CFP intensity through the course of the experiment.
For this plot, pixels were selected which never reached maximum values, yet whose average was above 100, to ensure monitoring of true CFP and not background signal. Note that the vertical axis begins at 160 and not 0, better to show the small changes (~10%).

