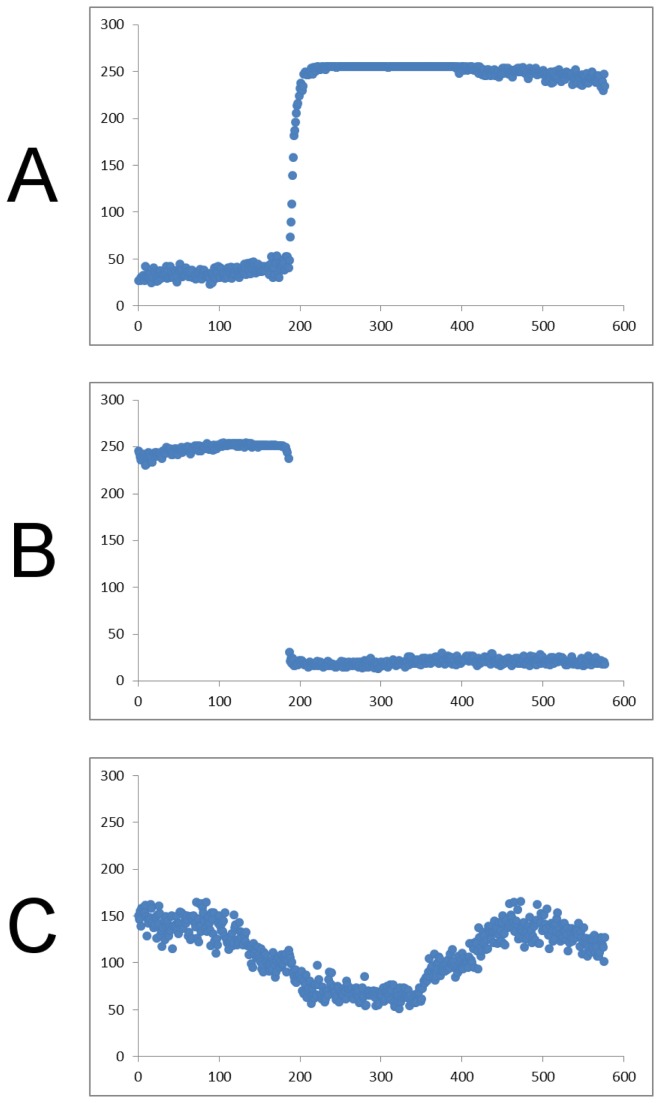
Figure 4. Traces of CFP intensities from three types of unreliable individual pixels, as a function of frame number.
A and B: pixels which manifest dramatic changes in intensities, probably as a result of fluorescent material entering or leaving that pixel, both occurring approximately at frame 200. These pixels were detected quantitatively as outliers in maximum and minimum smoothed slopes, respectively. C: Generally noisy pixel, detected as an outlier in standard deviation of smoothed slope.

