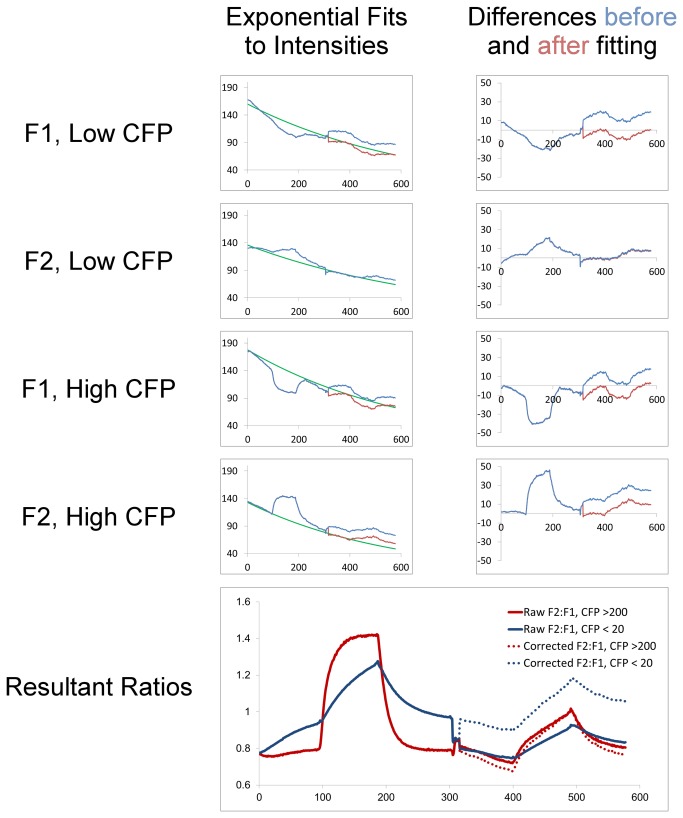
Figure 7. Correction procedure for raw fluorescence intensities.
Left column of traces: raw (blue) and corrected (red) fluorescence intensities derived from pixel-groups indicated (F1 or F2, High- or Low-CFP), with exponential curves (green) fit to the high chloride phases in the pre-calcimycin stage of the experiment. Right column of traces: differences between exponential fits and observed intensities, before (blue) and after (red) the addition of a constant magnitude to minimize differences. Bottom: traces of F2: F1 ratios resulting from the raw (solid lines) or corrected (dashed lines) fluorescence intensities.

