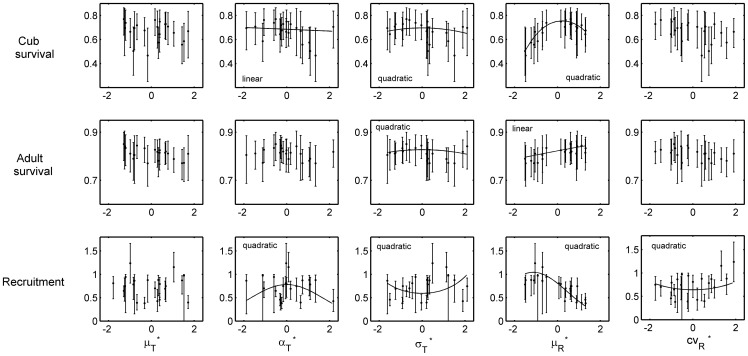
Figure 2. Survival rate estimates, for juveniles and adults, and recruitment rate as a function of climate metrics, with 95% confidence intervals (error bars, based on model averaging).
The solid curve represents the statistically significant link between life-history parameters and climate metrics, for which we indicate whether the linear or quadratic (or both) component(s) was (were) significant. Importantly, a significant linear component does not imply a straight line in the representation shown, as the relationship is defined as linear within a logistic transformation (for survival rates), or within a log transformation (for recruitment).

