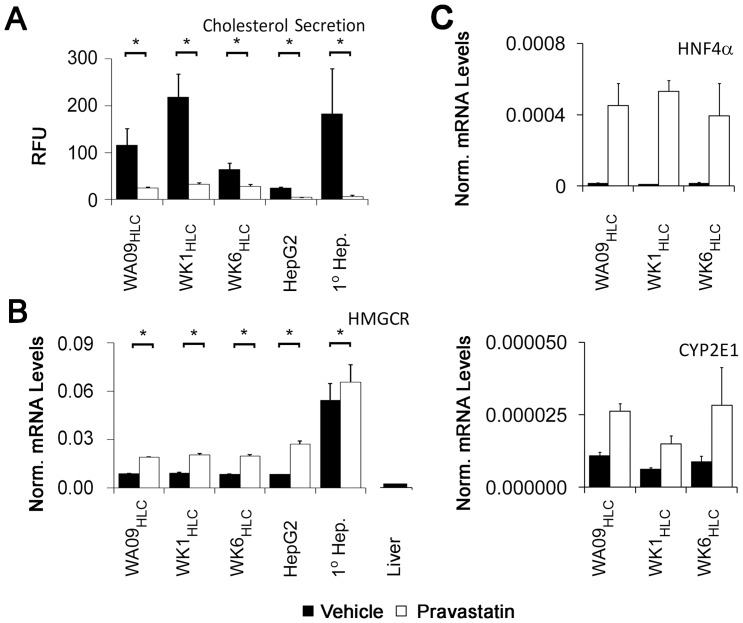
Figure 6. Pravastatin induced reduction in cholesterol secretion of stage 3B HLCs derived from iPSCs.
(A) Suppression of cholesterol secretion by treatment of HLCs with pravastatin at 10 μM for 48 hours, as assayed by quantitative fluorometric assessment for cholesterol in cell-fee conditioned medium. T-tests on triplicate values from treated and untreated cells were used to generate p-values. (B) Analysis of HMGCR transcriptional regulation by pravastatin (for cell-type nomenclature see Fig. 3A legend). Also shown is the HMGCR mRNA level from a 2 year old female liver sample. Scales for the liver and HLC samples are identical. (C) Analysis of HNF4α and CYP2E1 transcriptional regulation by pravastatin (for cell-type nomenclature see Fig. 3A legend). Error bars represent the standard error of the mean.

