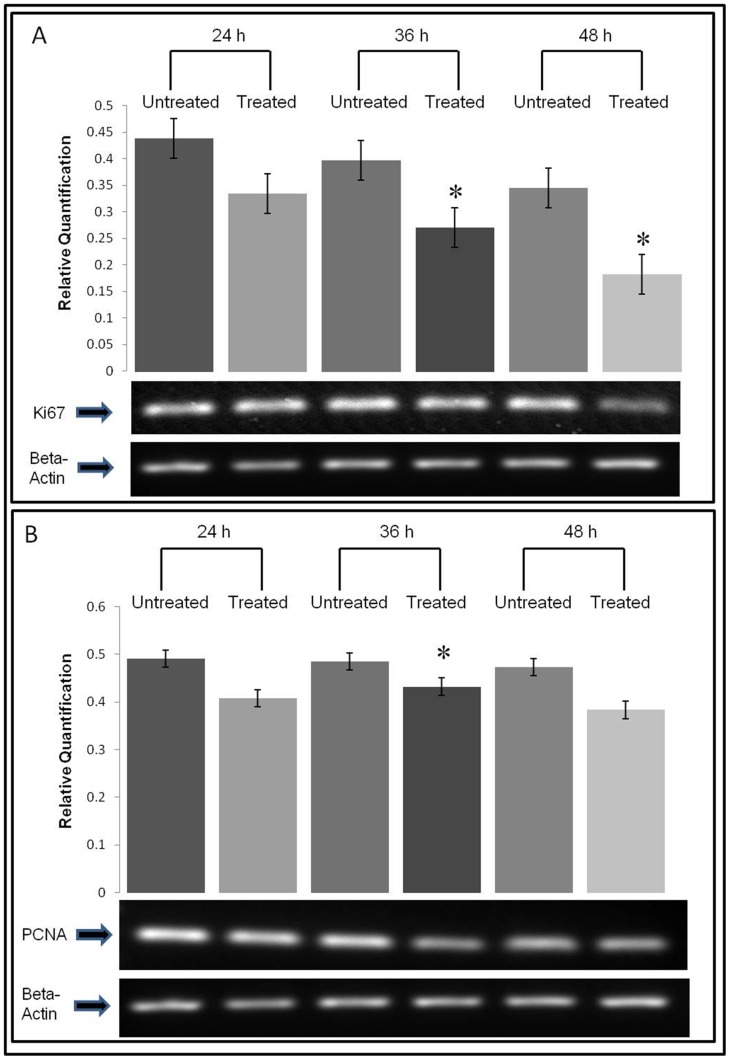
Figure 4. The expressions of proliferation markers on the SN-F11/12-treated MDA-MB-231 cells.
The figures show normalised mRNA expression of (A) Ki67 and (B) PCNA on the treated MDA-MB-231 cells. The target gene mRNA expression was normalised to the mRNA expression of beta-actin. Each data represents mean ± SE from three independent experiments. Statistical analysis was determined using the Student’s t test with *p<0.05 as statistical significance, compared to the non-treated cells at each time point.

