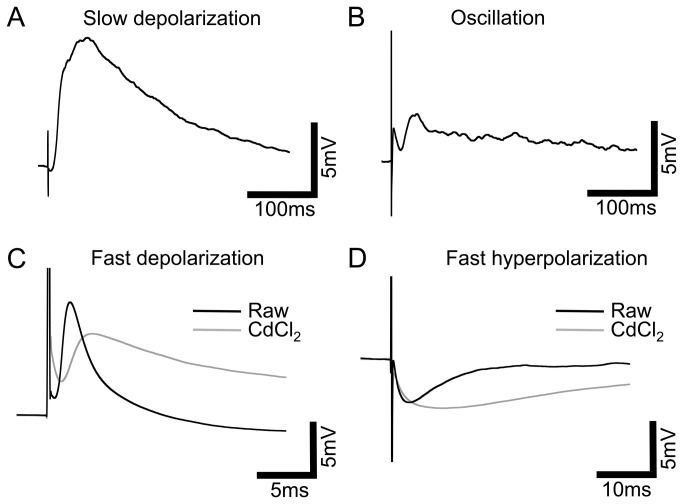
Figure 2. Four patterns of response to electrical stimulation in rd/rd retinal INL cells.
Representative averaged traces from a variety of INL cell types in the rd/rd retina, black traces: A, Slow depolarization (peak occurring >10ms after stimulus onset). B, Oscillation, positive and negative responses continuing >10ms after stimulus onset. C, Fast depolarization (<10ms after stimulus onset). D, Fast hyperpolarization (<10ms after stimulus onset). Grey traces: representative averaged traces (not necessarily from the same cell) after treatment with the synaptic blocker CdCl2 (0.5mM), response amplitudes were not significantly altered but slow depolarization and oscillation responses were completely blocked. Note different scales for fast responses.

