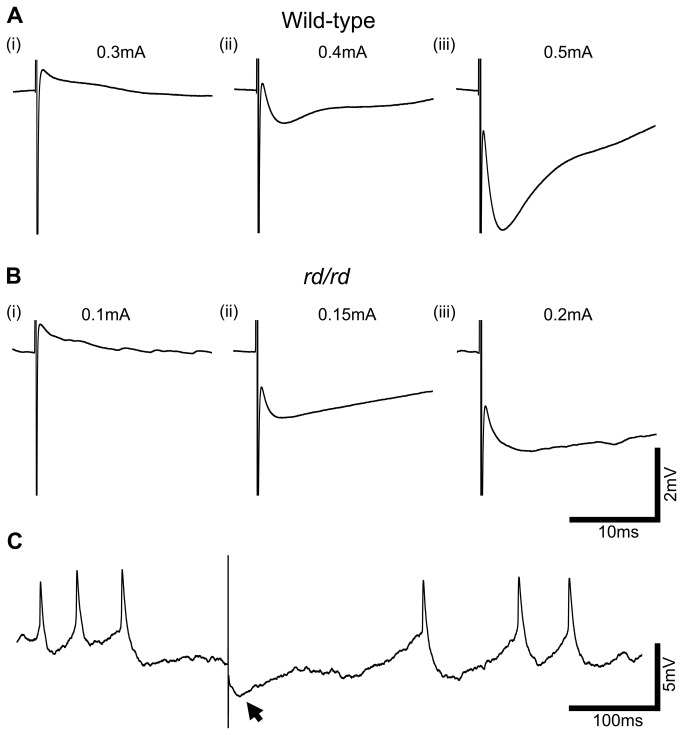
Figure 3. Response amplitude and polarity change in a dose dependent manner with stimulus intensity.
A and B, Representative averaged traces from wild-type and rd/rd INL cells, under CdCl2 (0.5mM), display fast depolarization responses at low stimulus amplitudes that reverse in polarity as stimulus intensity is increased. C, Raw trace from the rd/rd cell shows the existence of a large amplitude membrane oscillation, even under synaptic block, that is larger than the electrically evoked response, shown with arrow.

