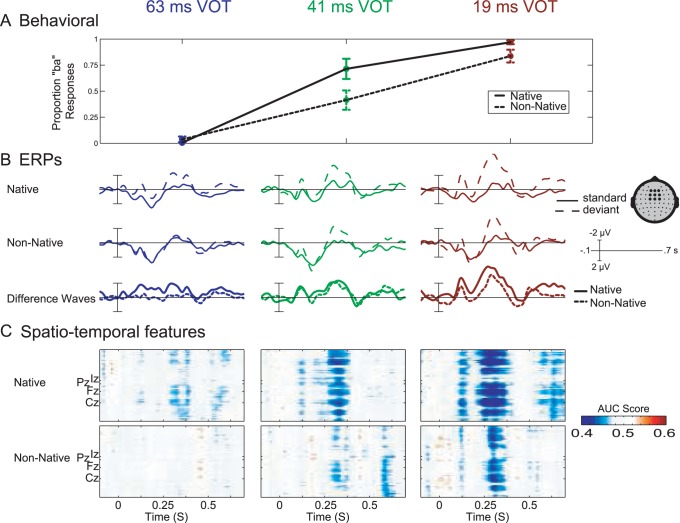
Figure 2. Group level behavioral and ERP responses.
a) Mean behavioral identification scores for native and non-native speakers for the three deviant stimuli. b) Group-level ERPs for both the standard and deviant stimuli are presented in each of the three measurement conditions for both native-English and native-Dutch participants. Responses are averaged across nine fronto-central electrode locations, indicated by the large dots in the scalp map presented above (see also Table 1). In addition, difference waves have been derived for each language group by subtracting the grand-average responses to the standard stimulus from that of the deviant stimulus in each of the measurement conditions. c) Area under the ROC-curve scores for spatio-temporal features across the three deviant conditions for both native and non-native participants. The relative locations of four midline electrodes are indicated for reference.

