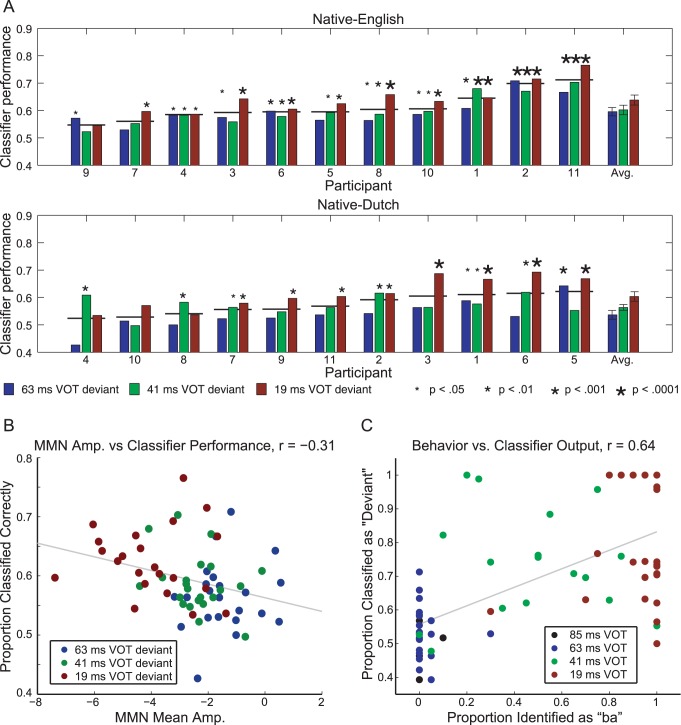
Figure 3. Within-participant classification analyses.
a) Classification rates for native and non-native participants for each of the three stimulus conditions along with group averages (shown with error bars). Participants are sorted based on the averaged results of the three analyses, as indicated by the horizontal lines. Asterisk size indicates the significance level of the result in each of the three conditions. b) Scatter plot of classifier performance with respect to the mean amplitude of the MMN component of individual ERPs measured in the study by Brandmeyer, Desain and McQueen [16]. c) Scatter plot of mean classifier decision rates per condition with respect to behavioral decisions in the identification task reported in that study.

