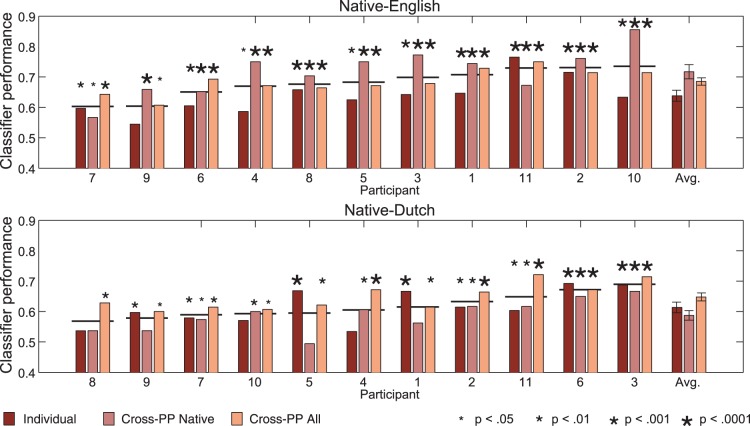
Figure 5. Cross-participant classification analyses.
Classification rates for native and non-native participants for the two classifiers trained on cross-participant data sets using the 19 ms VOT deviant, along with individual rates from the within-participant classification analysis of the same deviant condition. Results for each of the three datasets are indicated using different colored bars. Participants are sorted based on the averaged results of the three analyses, as indicated by the horizontal lines. Group averages are also shown with error bars. Asterisk size indicates the significance level of a given ndividual result.

