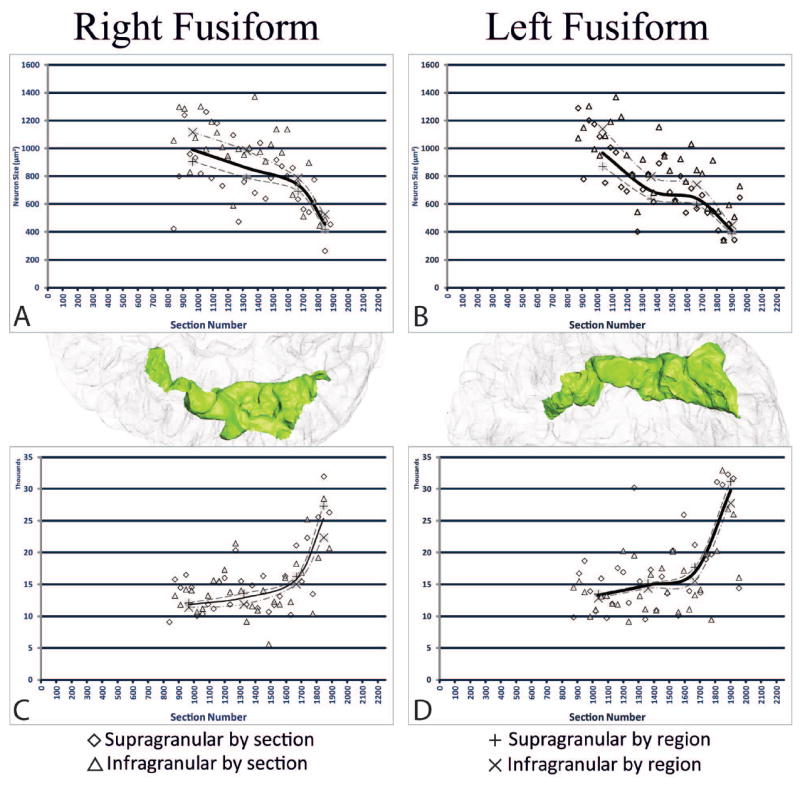
Figure 5.

The stereological data in the right and left FG for neuron size and neuron density plotted against section number (actual section collected). A. Neuron size in right FG; B. Neuron size in left FG; C. Neuron density in right FG; D. Neuron density in left FG. The X (supragranular) and + (infragranular) indicate the values for each sub region, while the solid line is the average across regions for both supra-and infra- granular regions together. Neuron size and neuron density vary inversely with each other. Posterior regions exhibit greater neuron density with smaller neuron size, while anterior regions display larger neuron size with lesser neuron density.
